For ACT Students
The ACT is a timed exam...60 questions for 60 minutes
This implies that you have to solve each question in one minute.
Some questions will typically take less than a minute a solve.
Some questions will typically take more than a minute to solve.
The goal is to maximize your time. You use the time saved on those questions you
solved in less than a minute, to solve the questions that will take more than a minute.
So, you should try to solve each question correctly and timely.
So, it is not just solving a question correctly, but solving it correctly on time.
Please ensure you attempt all ACT questions.
There is no negative penalty for any wrong answer.
For SAT Students
Any question labeled SAT-C is a question that allows a calculator.
Any question labeled SAT-NC is a question that does not allow a calculator.
For JAMB Students
Calculators are not allowed. So, the questions are solved in a way that does not require a calculator.
For WASSCE Students
Any question labeled WASCCE is a question for the WASCCE General Mathematics
Any question labeled WASSCE-FM is a question for the WASSCE Further Mathematics/Elective Mathematics
For NSC Students
For the Questions:
Any space included in a number indicates a comma used to separate digits...separating multiples of three digits from behind.
Any comma included in a number indicates a decimal point.
For the Solutions:
Decimals are used appropriately rather than commas
Commas are used to separate digits appropriately.
Solve all questions.
Show all work.
Course | Grade | Point | Credit Hour (CH) | Grade Point, (GP) = Point * Credit Hour |
Algebra | $A$ | $4$ | $4$ | $4 * 4 = 16$ |
English | $B$ | $3$ | $3$ | $3 * 3 = 9$ |
Biology | $B$ | $3$ | $4$ | $3 * 4 = 12$ |
Chemistry | $A$ | $4$ | $4$ | $4 * 4 = 16$ |
Chinese | $C$ | $2$ | $1$ | $2 * 1 = 2$ |
$\Sigma CH = 16$ | $\Sigma GP = 55$ |
Marks | $1$ | $2$ | $3$ | $4$ | $5$ |
Frequencies | $2$ | $2$ | $8$ | $4$ | $4$ |
Marks, $x$ | Frequencies, $f$ | $f * x$ |
$1$ | $2$ | $2$ |
$2$ | $2$ | $4$ |
$3$ | $8$ | $24$ |
$4$ | $4$ | $16$ |
$5$ | $4$ | $20$ |
$\Sigma f = 20$ | $\Sigma fx = 66$ |
Score interval | Frequency |
$96-100$ | $3$ |
$91-95$ | $1$ |
$86-90$ | $3$ |
$81-85$ | $4$ |
$76-80$ | $9$ |
Data Value | Frequency |
$51$ | $1$ |
$61$ | $1$ |
$62$ | $1$ |
$57$ | $1$ |
$50$ | $1$ |
$67$ | $1$ |
$68$ | $1$ |
$58$ | $1$ |
$53$ | $1$ |
(15.) CSEC (a) The information below represents the minimum temperatures, in °C, recorded in Country A for the first 20 days in a particular month.
21 | 23 | 25 | 22 | 24 | 25 | 23 | 26 | 23 | 24 |
25 | 26 | 23 | 25 | 23 | 25 | 24 | 25 | 25 | 25 |
(i) Complete the frequency table below, using the information above.
Temperature ($^\circ C$) | Tally | Frequency |
---|---|---|
$21$ | I | $1$ |
$22$ | I | $1$ |
$23$ | ||
$24$ | III | $3$ |
$25$ | ||
$26$ |
(ii) Determine the median temperature.
(iii) Calculate the mean temperature for the twenty-day period.
Temperature, $x$ ($^\circ C$) | Tally | Frequency, $f$ | $f * x$ |
---|---|---|---|
$21$ | I | $1$ | $21$ |
$22$ | I | $1$ | $22$ |
$23$ | $5$ | $115$ | |
$24$ | III | $3$ | $72$ |
$25$ | $8$ | $200$ | |
$26$ | II | $2$ | $52$ |
$\Sigma f = 20$ | $\Sigma fx = 482$ |
(16.) The ages of the 2016 United States Presidential candidates from 4 political parties are:
70 | 64 | 45 | 45 | 65 | 63 | 66 | 54 | 62 | 58 |
53 | 61 | 71 | 61 | 45 | 48 | 66 | 53 | 63 | 70 |
55 | 68 | 75 | 65 | 63 |
Calculate the measures of central tendency of the data set.
Ages, $x$ | Frequency, $f$ | $f * x$ |
---|---|---|
$45$ | $3$ | $135$ |
$48$ | $1$ | $48$ |
$53$ | $2$ | $106$ |
$54$ | $1$ | $54$ |
$55$ | $1$ | $55$ |
$58$ | $1$ | $58$ |
$61$ | $2$ | $122$ |
$62$ | $1$ | $62$ |
$63$ | $3$ | $189$ |
$64$ | $1$ | $64$ |
$65$ | $2$ | $130$ |
$66$ | $2$ | $132$ |
$68$ | $1$ | $68$ |
$70$ | $2$ | $140$ |
$71$ | $1$ | $71$ |
$75$ | $1$ | $75$ |
$\Sigma f = 25$ | $\Sigma fx = 1509$ |
60 | 50 | 40 | 67 | 53 | 73 | 37 | 55 | 62 | 43 |
44 | 69 | 39 | 32 | 45 | 58 | 48 | 67 | 39 | 51 |
46 | 59 | 40 | 52 | 61 | 48 | 23 | 60 | 59 | 47 |
65 | 58 | 74 | 47 | 40 | 59 | 68 | 51 | 50 | 50 |
71 | 51 | 26 | 36 | 38 | 70 | 46 | 40 | 51 | 42 |
(a) Using class intervals $21-30, 31-40...$, prepare a frequency distribution table.
(b) Calculate the mean mark of the distribution.
(c) What percentage of the students scored more than $60$?
Marks, $x$ | Tally | Frequency, $f$ | $x_{mid} = \dfrac{LCI + UCI}{2}$ | $f * x_{mid}$ |
---|---|---|---|---|
$21-30$ | II | $2$ | $\dfrac{21 + 30}{2} = \dfrac{51}{2} = 25.5$ | $51$ |
$31-40$ | $10$ | $\dfrac{31 + 40}{2} = \dfrac{71}{2} = 35.5$ | $355$ | |
$41-50$ | $12$ | $\dfrac{41 + 50}{2} = \dfrac{91}{2} = 45.5$ | $546$ | |
$51-60$ | $15$ | $\dfrac{51 + 60}{2} = \dfrac{111}{2} = 55.5$ | $832.5$ | |
$61-70$ | $8$ | $\dfrac{61 + 70}{2} = \dfrac{131}{2} = 65.5$ | $524$ | |
$71-80$ | III | $3$ | $\dfrac{71 + 80}{2} = \dfrac{151}{2} = 75.5$ | $226.5$ |
$\Sigma f = 50$ | $\Sigma fx_{mid} = 2535$ |
5 | 4 | 6 | 3 | 2 | 1 | 7 | 4 | 5 | 3 |
6 | 5 | 4 | 3 | 7 | 6 | 2 | 5 | 4 | 5 |
5 | 7 | 5 | 4 | 3 | 2 | 1 | 6 | 3 | 4 |
(a) Copy and complete the frequency table for the data shown above.
Number of Books $(x)$ | Tally | Frequency $(f)$ | $f * x$ |
---|---|---|---|
$1$ | II | $2$ | $2$ |
$2$ | III | $3$ | $6$ |
$3$ | $...$ | $...$ | |
$4$ | $...$ | $...$ | |
$5$ | $...$ | $...$ | |
$6$ | $...$ | $...$ | |
$7$ | $...$ | $...$ |
(b) State the modal number of books in the bags of the sample of students.
(c) Using the table in (a) above, or otherwise, calculate
(i) the TOTAL number of books
(ii) the mean number of books per bag.
(d) Determine the probability that a student chosen at random has LESS THAN $4$ books in his/her bag.
Number of Books $(x)$ | Tally | Frequency $(f)$ | $f * x$ |
---|---|---|---|
$1$ | II | $2$ | $2$ |
$2$ | III | $3$ | $6$ |
$3$ | $5$ | $15$ | |
$4$ | $6$ | $24$ | |
$5$ | $7$ | $35$ | |
$6$ | IIII | $4$ | $24$ |
$7$ | III | $3$ | $21$ |
$\Sigma f = 30$ | $\Sigma fx = 127$ |
Ages in years | Frequency |
---|---|
$20 - 30$ | $3$ |
$31 - 40$ | $25$ |
$41 - 50$ | $17$ |
$51 - 60$ | $6$ |
$61 - 70$ | $1$ |
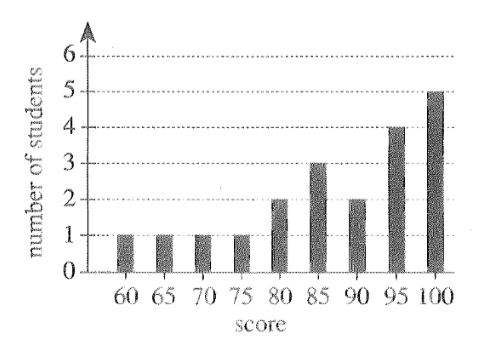
Scores, $x$ | Frequencies, $f$ | $f * x$ |
$60$ | $1$ | $60$ |
$65$ | $1$ | $65$ |
$70$ | $1$ | $70$ |
$75$ | $1$ | $75$ |
$80$ | $2$ | $160$ |
$85$ | $3$ | $255$ |
$90$ | $2$ | $180$ |
$95$ | $4$ | $380$ |
$100$ | $5$ | $500$ |
$\Sigma f = 20$ | $\Sigma fx = 1745$ |
Use the table below to answer the questions 33 and 34
JAMBScore | $4$ | $7$ | $8$ | $11$ | $13$ | $8$ |
Frequency | $3$ | $5$ | $2$ | $7$ | $2$ | $1$ |
Score, $x$ | Frequency, $f$ | $f * x$ |
$4$ | $3$ | $12$ |
$7$ | $5$ | $35$ |
$8$ | $2$ | $16$ |
$11$ | $7$ | $77$ |
$13$ | $2$ | $26$ |
$8$ | $1$ | $8$ |
$\Sigma f = 20$ | $\Sigma fx = 174$ |
Marks | $2$ | $3$ | $4$ | $5$ | $6$ | $7$ | $8$ |
No. of students | $3$ | $1$ | $5$ | $2$ | $4$ | $2$ | $3$ |
$x$ | $2$ | $4$ | $6$ | $8$ |
$f$ | $4$ | $y$ | $6$ | $5$ |
$x$ | $f$ | $fx$ |
---|---|---|
$2$ | $4$ | $8$ |
$4$ | $y$ | $4y$ |
$6$ | $6$ | $36$ |
$8$ | $5$ | $40$ |
$\Sigma f = 15 + y$ | $\Sigma fx = 84 + 4y$ |
Month | Number of cars sold |
---|---|
January | $25$ |
February | $15$ |
March | $22$ |
April | $19$ |
May | $16$ |
June | $13$ |
July | $19$ |
August | $25$ |
September | $26$ |
October | $27$ |
November | $28$ |
December | $29$ |
Age | $20$ | $25$ | $30$ | $35$ | $40$ | $45$ |
No. of people | $3$ | $5$ | $1$ | $1$ | $2$ | $3$ |
Numbers, $x$ | Frequencies, $f$ | $f * x$ |
$5$ | $3$ | $15$ |
$8$ | $2$ | $16$ |
$6$ | $4$ | $24$ |
$k$ | $1$ | $k$ |
$\Sigma f = 10$ | $\Sigma fx = 55 + k$ |
POSITION | NUMBER EMPLOYED IN POSITION | MONTHLY SALARY PER PERSON (IN RAND) |
Managing director | $1$ | $150\:000$ |
Director | $2$ | $100\:000$ |
Manager | $2$ | $75\:000$ |
Foreman | $5$ | $15\:000$ |
Skilled workers | $30$ | $10\:000$ |
Semi-skilled workers | $40$ | $7\:500$ |
Unskilled workers | $65$ | $6\:000$ |
Administration | $5$ | $5\:000$ |
(49.1) Calculate the total number of people employed at this company.
(49.2) Calculate the total amount needed to pay salaries for ONE month.
(49.3) Determine the mean monthly salary for an employee in this company.
(49.4) Is the mean monthly salary calculated in QUESTION (49.3) a good indicator of an employee's monthly salary?
Motivate your answer.
Height | $1.40 - 1.42$ | $1.43 - 1.45$ | $1.46 - 1.48$ | $1.49 - 1.51$ | $1.52 - 1.54$ | $1.55 - 1.57$ | $1.58 - 1.60$ | $1.61 - 1.63$ |
Number of students | $2$ | $4$ | $19$ | $30$ | $24$ | $14$ | $6$ | $1$ |
(a) Calculate the mean height of the distribution.
(b) What is the probability that the height of a student selected at random is greater than the mean height of the
distribution?
Height, $x$ | Frequency, $f$ | $x_{mid} = \dfrac{LCI + UCI}{2}$ | $f * x_{mid}$ |
---|---|---|---|
$1.40 - 1.42$ | $2$ | $\dfrac{1.4 + 1.42}{2} = \dfrac{2.82}{2} = 1.41$ | $2.82$ |
$1.43 - 1.45$ | $4$ | $\dfrac{1.43 + 1.45}{2} = \dfrac{2.88}{2} = 1.44$ | $5.76$ |
$1.46 - 1.48$ | $19$ | $\dfrac{1.46 + 1.48}{2} = \dfrac{2.94}{2} = 1.47$ | $27.93$ |
$1.49 - 1.51$ | $30$ | $\dfrac{1.49 + 1.51}{2} = \dfrac{3}{2} = 1.5$ | $45$ |
$1.52 - 1.54$ | $24$ | $\dfrac{1.52 + 1.54}{2} = \dfrac{3.06}{2} = 1.53$ | $36.72$ |
$1.55 - 1.57$ | $14$ | $\dfrac{1.55 + 1.57}{2} = \dfrac{3.12}{2} = 1.56$ | $21.84$ |
$1.58 - 1.6$ | $6$ | $\dfrac{1.58 + 1.6}{2} = \dfrac{3.18}{2} = 1.59$ | $9.54$ |
$1.61 - 1.63$ | $1$ | $\dfrac{1.61 + 1.63}{2} = \dfrac{3.24}{2} = 1.62$ | $1.62$ |
$\Sigma f = 100$ | $\Sigma fx_{mid} = 151.23$ |
Marks | $0 - 9$ | $10 - 19$ | $20 - 29$ | $30 - 39$ | $40 - 49$ | $50 - 59$ | $60 - 69$ | $70 - 79$ |
Number of students | $2$ | $5$ | $9$ | $15$ | $18$ | $14$ | $10$ | $7$ |
(a) If a student is selected at random from the group, find the probability that this student scored at most
$69$ marks.
(b) Calculate the median of the distribution.
Marks, $x$ | Frequency, $F$ | Class Boundaries | Cumulative Frequency, $CF$ |
---|---|---|---|
$0 - 9$ | $2$ | $0 - 9.5$ | $2$ |
$10 - 19$ | $5$ | $9.5 - 19.5$ | $2 + 5 = 7$ |
$20 - 29$ | $9$ | $19.5 - 29.5$ | $7 + 9 = 16$ |
$30 - 39$ | $15$ | $29.5 - 39.5$ | $16 + 15 = \color{darkblue}{31}$ |
$\color{darkblue}{40 - 49}$ | $\color{darkblue}{18}$ | $\color{darkblue}{39.5} - 49.5$ | $31 + 18 = 49$ |
$50 - 59$ | $14$ | $49.5 - 59.5$ | $49 + 14 = 63$ |
$60 - 69$ | $10$ | $59.5 - 69.5$ | $63 + 10 = 73$ |
$70 - 79$ | $7$ | $69.5 - 79.5$ | $73 + 7 = 80$ |
$\Sigma F = 80$ |
Length (m) | $1.0 - 1.1$ | $1.2 - 1.3$ | $1.4 - 1.5$ | $1.6 - 1.7$ | $1.8 - 1.9$ |
Frequency | $2$ | $3$ | $8$ | $5$ | $2$ |
Using an assumed mean (AM) of $1.45$, calculate the mean of the distribution.
Length (m), $x$ | Frequency, $f$ | $x_{mid} = \dfrac{LCI + UCI}{2}$ | $D = x_{mid} - AM$ | $f * D$ |
---|---|---|---|---|
$1.0 - 1.1$ | $2$ | $\dfrac{1.0 + 1.1}{2} = \dfrac{2.1}{2} = 1.05$ | $1.05 - 1.45 = -0.4$ | $2(-0.4) = -0.8$ |
$1.2 - 1.3$ | $3$ | $\dfrac{1.2 + 1.3}{2} = \dfrac{2.5}{2} = 1.25$ | $1.25 - 1.45 = -0.2$ | $3(-0.2) = -0.6$ |
$1.4 - 1.5$ | $8$ | $\dfrac{1.4 + 1.5}{2} = \dfrac{2.9}{2} = 1.45$ | $1.45 - 1.45 = 0$ | $8(0) = 0$ |
$1.6 - 1.7$ | $5$ | $\dfrac{1.6 + 1.7}{2} = \dfrac{3.3}{2} = 1.65$ | $1.65 - 1.45 = 0.2$ | $5(0.2) = 1.0$ |
$1.8 - 1.9$ | $2$ | $\dfrac{1.8 + 1.9}{2} = \dfrac{3.7}{2} = 1.85$ | $1.85 - 1.45 = 0.4$ | $2(0.4) = 0.8$ |
$\Sigma f = 20$ | $\Sigma fD = 0.4$ |
No. of children | $0$ | $1$ | $2$ | $3$ | $4$ | $5$ | $6$ |
No. of families | $7$ | $11$ | $6$ | $7$ | $7$ | $5$ | $3$ |
Statistic | Points |
Median Range Maximum |
80 11 90 |
Car companies | ||||
Age (in years) | A | B | C | Total |
16 – 25 26 – 45 46 – 60 |
16 54 65 |
24 48 23 |
40 53 12 |
80 155 100 |
Total | 135 | 95 | 105 | 335 |
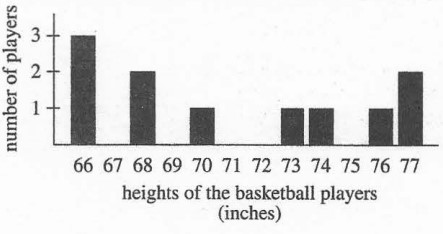
Heights of the basketball players, x | Number of players, f | f * x |
66 | 3 | 66 * 3 = 198 |
68 | 2 | 68 * 2 = 136 |
70 | 1 | 70 * 1 = 70 |
73 | 1 | 73 * 1 = 73 |
74 | 1 | 74 * 1 = 74 |
76 | 1 | 76 * 1 = 76 |
77 | 2 | 77 * 2 = 154 |
Σf = 11 | Σfx = 781 |
Title | Year of release | Length (minutes) |
The Trouble with Harry The Man Who Knew Too Much The Wrong Man Vertigo North by Northwest Psycho The Birds Marnie Torn Curtain Topaz Frenzy Family Plot |
1955 1956 1956 1958 1959 1960 1963 1964 1966 1969 1972 1976 |
99 120 105 128 136 109 119 130 128 143 ? ? |
Wages ($\$$) | $40 - 49$ | $50 - 59$ | $60 - 69$ | $70 - 79$ | $80 - 89$ | $90 - 99$ | $100 - 109$ | $110 - 119$ |
Number of Employees | $4$ | $12$ | $14$ | $11$ | $7$ | $5$ | $2$ | $1$ |
Using an assumed mean (AM) of $\$74.50$, find the mean wage.
Wages ($\$$), $x$ | Number of Employees, $f$ | $x_{mid} = \dfrac{LCI + UCI}{2}$ | $D = x_{mid} - AM$ | $f * D$ |
---|---|---|---|---|
$40 - 49$ | $4$ | $\dfrac{40 + 49}{2} = \dfrac{89}{2} = 44.5$ | $44.5 - 74.5 = -30$ | $4(-30) = -120$ |
$50 - 59$ | $12$ | $\dfrac{50 + 59}{2} = \dfrac{109}{2} = 54.5$ | $54.5 - 74.5 = -20$ | $12(-20) = -240$ |
$60 - 69$ | $14$ | $\dfrac{60 + 69}{2} = \dfrac{129}{2} = 64.5$ | $64.5 - 74.5 = -10$ | $14(-10) = -140$ |
$70 - 79$ | $11$ | $\dfrac{70 + 79}{2} = \dfrac{149}{2} = 74.5$ | $74.5 - 74.5 = 0$ | $11(0) = 0$ |
$80 - 89$ | $7$ | $\dfrac{80 + 89}{2} = \dfrac{169}{2} = 84.5$ | $84.5 - 74.5 = 10$ | $7(10) = 70$ |
$90 - 99$ | $5$ | $\dfrac{90 + 99}{2} = \dfrac{189}{2} = 94.5$ | $94.5 - 74.5 = 20$ | $5(20) = 100$ |
$100 - 109$ | $2$ | $\dfrac{100 + 109}{2} = \dfrac{209}{2} = 104.5$ | $104.5 - 74.5 = 30$ | $2(30) = 60$ |
$110 - 119$ | $1$ | $\dfrac{110 + 119}{2} = \dfrac{229}{2} = 114.5$ | $114.5 - 74.5 = 40$ | $1(40) = 40$ |
$\Sigma f = 56$ | $\Sigma fD = -230$ |
Age (in years), $x$ | Number of people, $f$ | $x_{mid} = \dfrac{LCI + UCI}{2}$ | $D = x_{mid} - AM$ | $f * D$ |
---|---|---|---|---|
$1 - 5$ | $18$ | $\dfrac{1 + 5}{2} = \dfrac{6}{2} = 3$ | $3 - 13 = -10$ | $18(-10) = -180$ |
$6 - 10$ | $12$ | $\dfrac{6 + 10}{2} = \dfrac{16}{2} = 8$ | $8 - 13 = -5$ | $12(-5) = -60$ |
$11 - 15$ | $25$ | $\dfrac{11 + 15}{2} = \dfrac{26}{2} = 13$ | $13 - 13 = 0$ | $25(0) = 0$ |
$16 - 20$ | $15$ | $\dfrac{16 + 20}{2} = \dfrac{36}{2} = 18$ | $18 - 13 = 5$ | $15(5) = 75$ |
$21 - 25$ | $20$ | $\dfrac{21 + 25}{2} = \dfrac{46}{2} = 23$ | $23 - 13 = 10$ | $20(10) = 200$ |
$26 - 30$ | $10$ | $\dfrac{26 + 30}{2} = \dfrac{56}{2} = 28$ | $28 - 13 = 15$ | $10(15) = 150$ |
$\Sigma f = 100$ | $\Sigma fD = 185$ |
School | Number of tickets sold | Tickets sales |
A B C D E |
200 250 300 150 275 |
$1,400 $1,650 $1,800 $1,350 $1,625 |
Rating | Number of customers |
3 2 1 0 |
6 8 2 4 |
Rating, x | Number of customers, f | f * x |
3 2 1 0 |
6 8 2 4 |
3 * 6 = 18 2 * 8 = 16 1 * 2 = 2 0 * 4 = 0 |
Σf = 20 | Σfx = 36 |
Age (in years), $x$ | Number of people, $f$ | $x_{mid} = \dfrac{LCI + UCI}{2}$ | $D = x_{mid} - AM$ | $f * D$ |
---|---|---|---|---|
$1 - 5$ | $18$ | $\dfrac{1 + 5}{2} = \dfrac{6}{2} = 3$ | $3 - 13 = -10$ | $18(-10) = -180$ |
$6 - 10$ | $12$ | $\dfrac{6 + 10}{2} = \dfrac{16}{2} = 8$ | $8 - 13 = -5$ | $12(-5) = -60$ |
$11 - 15$ | $25$ | $\dfrac{11 + 15}{2} = \dfrac{26}{2} = 13$ | $13 - 13 = 0$ | $25(0) = 0$ |
$16 - 20$ | $15$ | $\dfrac{16 + 20}{2} = \dfrac{36}{2} = 18$ | $18 - 13 = 5$ | $15(5) = 75$ |
$21 - 25$ | $20$ | $\dfrac{21 + 25}{2} = \dfrac{46}{2} = 23$ | $23 - 13 = 10$ | $20(10) = 200$ |
$26 - 30$ | $10$ | $\dfrac{26 + 30}{2} = \dfrac{56}{2} = 28$ | $28 - 13 = 15$ | $10(15) = 150$ |
$\Sigma f = 100$ | $\Sigma fD = 185$ |
Age (in years) | $1 - 5$ | $6 - 10$ | $11 - 15$ | $16 - 20$ | $21 - 25$ | $26 - 30$ |
Number of people | $18$ | $12$ | $25$ | $15$ | $20$ | $10$ |
Using an assumed mean (AM) of $13$ years, find the mean age of the people.
Age (in years), $x$ | Number of people, $f$ | $x_{mid} = \dfrac{LCI + UCI}{2}$ | $D = x_{mid} - AM$ | $f * D$ |
---|---|---|---|---|
$1 - 5$ | $18$ | $\dfrac{1 + 5}{2} = \dfrac{6}{2} = 3$ | $3 - 13 = -10$ | $18(-10) = -180$ |
$6 - 10$ | $12$ | $\dfrac{6 + 10}{2} = \dfrac{16}{2} = 8$ | $8 - 13 = -5$ | $12(-5) = -60$ |
$11 - 15$ | $25$ | $\dfrac{11 + 15}{2} = \dfrac{26}{2} = 13$ | $13 - 13 = 0$ | $25(0) = 0$ |
$16 - 20$ | $15$ | $\dfrac{16 + 20}{2} = \dfrac{36}{2} = 18$ | $18 - 13 = 5$ | $15(5) = 75$ |
$21 - 25$ | $20$ | $\dfrac{21 + 25}{2} = \dfrac{46}{2} = 23$ | $23 - 13 = 10$ | $20(10) = 200$ |
$26 - 30$ | $10$ | $\dfrac{26 + 30}{2} = \dfrac{56}{2} = 28$ | $28 - 13 = 15$ | $10(15) = 150$ |
$\Sigma f = 100$ | $\Sigma fD = 185$ |
Rating | Percentage |
1 2 3 4 5 |
0% 0% 10% 70% 20% |
Rating, x | Percentage | Frequency, f | f * x |
1 2 3 4 5 |
0% 0% 10% 70% 20% |
0 0 10 70 20 |
0 0 30 280 100 |
Σ f = 100 | Σ fx = 410 |
Age groups | Number |
---|---|
21 – 30 31 – 40 41 – 50 51 or older |
2,750 1,225 625 400 |
Moviegoer category | Number |
---|---|
Very often Often Sometimes Rarely |
830 1,650 2,320 200 |
Assessment | Weight (%) | Score | Weighted Score |
---|---|---|---|
Test 1 | 20 | 78 | 1560 |
Test 2 | 20 | 86 | 1720 |
Test 3 | 20 | 82 | 1640 |
Final Exam | 40 | $p$ | $40p$ |
$\Sigma Weights = 100$ | $\Sigma Weighted\;\;Scores = 4920 + 40p$ |
Use the following information to answer Questions 103 – 105
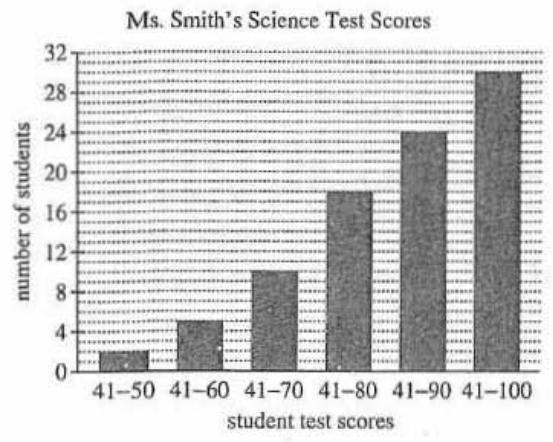
ACT The whole number test scores of all 30 students in Ms. Smith's science class are represented in the cumulative
frequency bar graph below.
Student Test Scores | Number of Students (Cumulative Frequencies) | Frequencies, F |
---|---|---|
41 – 50 | 2 | $2$ |
41 – 60 | 5 | $5 - 2 = 3$ |
41 – 70 | 10 | $10 - 5 = 5$ |
41 – 80 | 18 | $18 - 10 = 8$ |
41 – 90 | 24 | $24 - 18 = 6$ |
41 – 100 | 30 | $30 - 24 = 6$ |
$\Sigma F = 30$ |
Class Intervals | Frequency, F |
---|---|
41 – 50 | 2 |
51 – 60 | 3 |
61 – 70 | 5 |
71 – 80 | 8 |
81 – 90 | 6 |
91 – 100 | 6 |
$\Sigma F = 30$ |
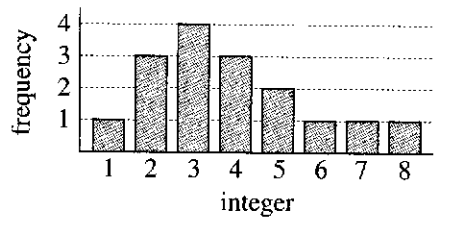
Integer, x | Frequency, F | Fx |
---|---|---|
1 | 1 | 1 |
2 | 3 | 6 |
3 | 4 | 12 |
4 | 3 | 12 |
5 | 2 | 10 |
6 | 1 | 6 |
7 | 1 | 7 |
8 | 1 | 8 |
ΣF = 16 | Σ Fx = 62 |
Range | Course grade |
---|---|
At least 90% | A |
80% – 89% | B |
70% – 79% | C |
60% – 69% | D |
Less than 60% | F |