Solved Examples: Inferential Statistics: Mean


Samuel Dominic Chukwuemeka (SamDom For Peace) For ACT Students
The ACT is a timed exam...60 questions for 60 minutes
This implies that you have to solve each question in one minute.
Some questions will typically take less than a minute a solve.
Some questions will typically take more than a minute to solve.
The goal is to maximize your time. You use the time saved on those questions you solved in less than a minute, to solve the questions that will take more than a minute.
So, you should try to solve each question correctly and timely.
So, it is not just solving a question correctly, but solving it correctly on time.
Please ensure you attempt all ACT questions.
There is no negative penalty for any wrong answer.

For NSC Students
For the Questions:
Any space included in a number indicates a comma used to separate digits...separating multiples of three digits from behind.
Any comma included in a number indicates a decimal point.
For the Solutions:
Decimals are used appropriately rather than commas
Commas are used to separate digits appropriately.

Solve all questions.
Show all work.

Please Note: Do not round intermediate calculations.
If you must round intermediate calculations, round them to at least four decimal places more than the number of decimals required for the final answer.
For example; if the final answer requires rounding to 3 decimal places, then round your intermediate calculations to at least 7 decimal places.

The names of the towns (in italics) are written to make you smile.
Yes, those towns exist. 😊
I want to make this topic fun in any way I can.
(1.) (a.) Interpret the statement: 99% confidence interval is: 4.1 < μ < 5.2

(b.) A confidence interval for a population mean has a margin of error of 3.9.
Determine the length of the confidence interval.


(a.) We are 99% confident that the interval from 4.1 to 5.2 actually contain the true value of the population mean.

$ (b.) \\[3ex] LCI = 2E \\[3ex] LCI = 2(3.9) \\[3ex] LCI = 7.8 $
(2.) Determine whether the interpretation is valid or invalid.
A university is trying to accommodate its commuter students in its course scheduling.
In a survey, the school asked a sample of 75 randomly chosen students how long their daily commute is, in minutes.
The data showed a 99% confidence interval of (74.4, 86.8) for the mean commute time for students at the university.
If 100 more surveys are conducted (each using a sample with members chosen randomly and independently), it is expected that exactly 99 of them will each produce a 99% confidence interval that contains its sample mean.


The interpretation is invalid.
If 100 more students are chosen randomly to do the survey, it is guaranteed that all 100, not just 99 of them, will each produce a 99% confidence interval that contains the sample mean.
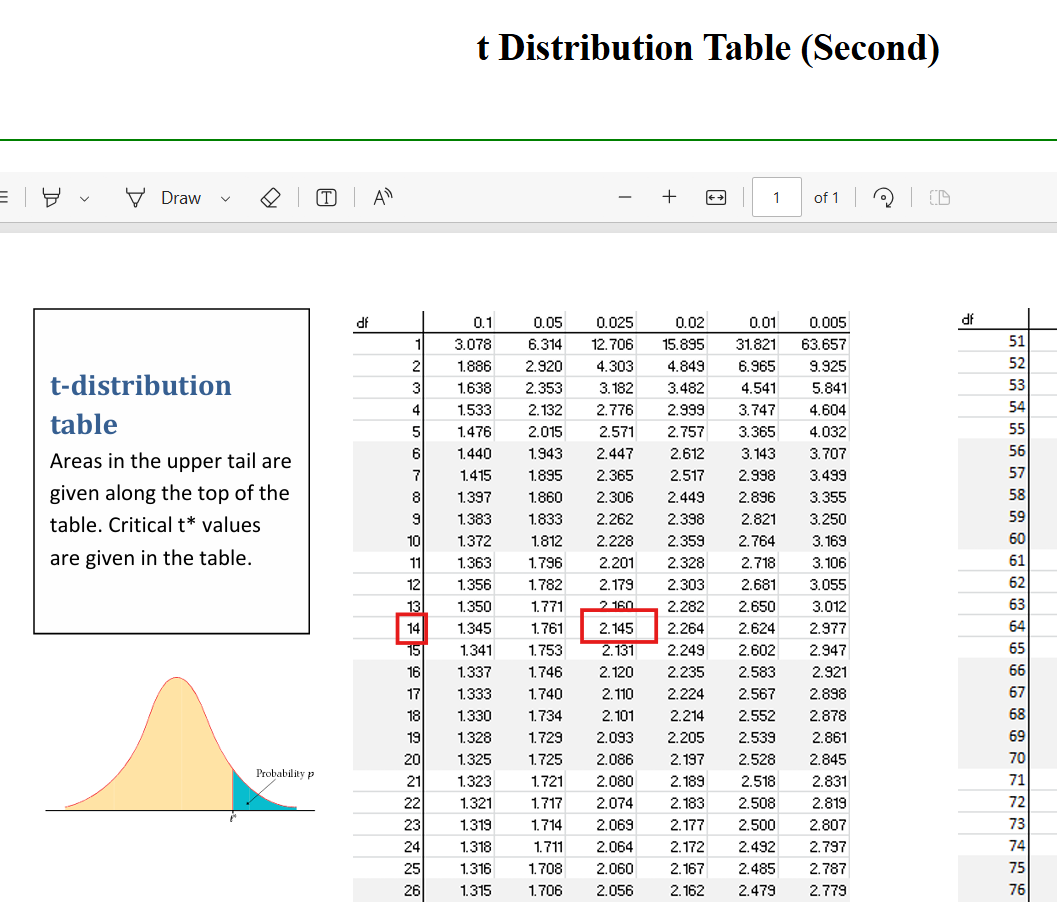
(3.) Determine the t-values such that:
(a.) The area in the right tail is 0.025 with 25 degrees of freedom.
(b.) The area left of the t-value is 0.25 with 28 degrees of freedom.
(c.) Critical t-value that corresponds to 98% confidence level with 7 degrees of freedom.


$ (a.) \\[3ex] One-tailed\;\;(Right-tailed) \\[3ex] \dfrac{\alpha}{2} = 0.025 \\[5ex] df = 25 \\[3ex] Critical\;\;t-value = 2.0595 \\[3ex] $ Number 3a

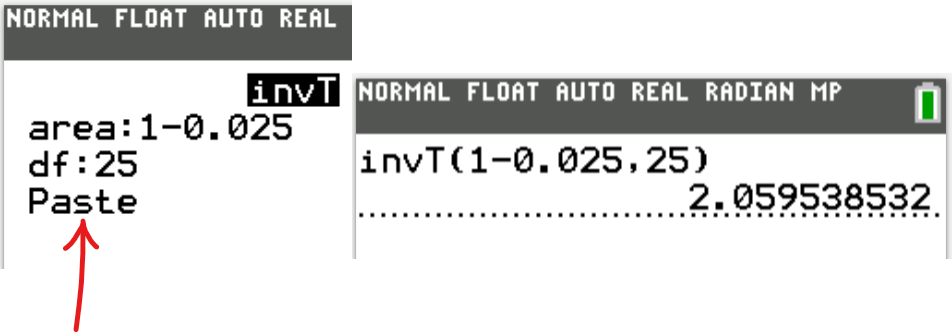
$ (b.) \\[3ex] One-tailed\;\;(Left-tailed) \\[3ex] \dfrac{\alpha}{2} = 0.25 \\[5ex] df = 28 \\[3ex] Critical\;\;t-value = -0.6834 \\[5ex] (c.) \\[3ex] CL = 98\% = 0.98 \\[3ex] \alpha = 1 - 0.98 = 0.02 \\[3ex] This\;\;could\;\;mean: \\[3ex] (i.)\;\;Two-tailed\;\;test \\[3ex] \alpha = 0.02 \\[3ex] df = 7 \\[3ex] Critical\;\;t-value = \pm 2.9980 \\[3ex] (ii.)\;\; One-tailed\;\;(Right-tailed) \\[3ex] \dfrac{\alpha}{2} = 0.02 \\[5ex] df = 7 \\[3ex] Critical\;\;t-value = 2.9980 \\[3ex] (iii.)\;\; One-tailed\;\;(Left-tailed) \\[3ex] \dfrac{\alpha}{2} = 0.02 \\[5ex] df = 7 \\[3ex] Critical\;\;t-value = -2.9980 $
(4.) Determine whether the interpretation is valid or invalid.
A tire manufacturer wants to examine the durability of its new product.
Company engineers randomly selected 175 new tires and measured the number of kilometers each can drive before blowing out.
The engineers found a 95% confidence interval of (18157.6, 18522.6) for the mean distance their new tires can drive before blowing out.
If 100 more samples are taken (with elements chosen randomly and independently), it is expected that exactly 100 of them will each produce a 95% confidence interval that contains its sample mean.


The interpretation is valid.
If 100 more samples are taken (with elements chosen randomly and independently), it is expected that exactly 100 of them will each produce a 95% confidence interval that contains its sample mean.
(5.) Interpret this confidence interval.
Rita wanted to determine the mean age of the residents of Romance, Arkansas. (Hmmm...is it better than "Virginia is for Lovers"?)
She surveyed 250 random people of the town and obtained a 90% confidence interval for the population mean age.
Approximately how many of those confidence intervals will contain the value of the average age of the population?


The 90% confidence interval means that about 90% of the samples (those random selected people) will contain the mean age of the population.

$ 90\%\;\;* 250 \\[3ex] 0.9 * 250 \\[3ex] 225 \\[3ex] $ About 225 residents will have the average age of the population.
(6.) Determine whether the interpretation is valid or invalid.
A manager at a Cereal company wants to confirm that there is an acceptable number of raisins in the company's family-sized boxes.
She counted the number of raisins in 100 randomly sampled boxes from the factory.
From the collected data, she computed a 90% confidence interval of (333.7, 357.1) for the mean number of raisins in family-sized boxes of the cereal.
If 100 more samples are taken (with elements chosen randomly and independently), it is expected that exactly 10 of them will each produce a 90% confidence interval that does not contain its sample mean.


The interpretation is invalid.
If 100 more samples are taken, it is guaranteed that all 100 of them will each produce a 90% confidence interval that contains its sample mean.
In other words, the number of 90% confidence intervals that do not contain the sample mean is guaranteed to be 0.
It is not expected to be 10.
(7.) A sample is taken from a population.
The size of the sample is 36
The mean of the sample is 123
The standard deviation of the population is 10
(a.) Construct a 95% confidence interval for the population mean.
(b.) Interpret your result.


$ n = 36 \\[3ex] \bar{x} = 123 \\[3ex] \sigma = 10 \\[3ex] CL = 95\% = 0.95 \\[3ex] \alpha = 1 - CL \\[3ex] \alpha = 1 - 0.95 \\[3ex] \alpha = 0.05 \\[3ex] \dfrac{\alpha}{2} = \dfrac{0.05}{2} = 0.025 \\[5ex] $ The population standard deviation was given
So, we have to use the $z$ distribution

$ z_{\dfrac{\alpha}{2}} = z_{0.025} = 1.9600 \\[5ex] E = \dfrac{\sigma * z_{\dfrac{\alpha}{2}}}{\sqrt{n}} \\[7ex] E = \dfrac{10 * 1.96}{\sqrt{36}} \\[5ex] E = \dfrac{19.6}{6} \\[5ex] E = 3.2\bar{6} \\[3ex] E \approx 3.27 \\[5ex] 95\%\:\: CI \\[3ex] = \bar{x} \pm E \\[3ex] = 123 \pm 3.27 \\[3ex] = 119.7\bar{3} \:\:and\:\: 126.2\bar{6} \\[3ex] \therefore 95\%\:\:CI = 119.73 \lt \mu \lt 126.27 \\[3ex] $ We are 95% confident that the population mean is within the margin of error of the sample mean of 123.
We are 95% confident that the population mean is between 119.73 and 126.27
(8.) Determine whether the interpretation is valid or invalid.
A farmer owned an orange grove and wanted to know how productive his trees were.
He randomly selected 75 trees in the grove and kept track of how many oranges each tree produced during one season.
He found a 99% confidence interval of (459.8, 481.6) for the mean number of oranges produced by his trees that season.
There is a 99% chance that the mean number of produced by his trees that season is in the interval (459.8, 481.6).


The interpretation is invalid.
The population mean is the average number of oranges produced by all of the farmer's trees that season, not just the ones in the sample.
(9.) James measured the mouth sizes of 10 randomly selected residents of the town of Sweet Lips, Tennessee (How sweet are their lips?).
The mouth sizes (in millimeters) are:

$13$ $35$ $36$ $38$ $16$
$25$ $8$ $18$ $21$ $26$

Determine the point estimate for the average of the mouth sizes of the entire residents.


$ \bar{x} = \dfrac{\Sigma x}{n} \\[5ex] = \dfrac{236}{10} \\[5ex] = 23.6 \\[3ex] $ The point estimate is 23.6 millimeters.
(10.) Determine whether the interpretation is valid or invalid.
A psychiatrist conducted a study about the effect of sleep deprivation on academic performance.
As part of the study, she surveyed 50 random students from a certain High School about their recent sleep patterns.
From the sample measurements, the psychiatrist calculated a 90% confidence interval of (45.4, 53.2) for the mean number of hours the high school students slept last week.
90% of the high school students slept between 45.4 and 53.2 hours last week.


The interpretation is invalid.
By chance, the original survey might have included only students that are heavy sleepers and sleep significantly more hours than what is average for the high school students.
(11.) Calculate the point estimate of the population mean and the margin of error for the confidence interval.
Lower bound = 16
Upper bound = 28


$ \bar{x} = \dfrac{upper\;\;confidence\;\;limit + lower\;\;confidence\;\;limit}{2} \\[5ex] \bar{x} = \dfrac{28 + 16}{2} \\[5ex] \bar{x} = 22 \\[5ex] E = \dfrac{upper\;\;confidence\;\;limit - lower\;\;confidence\;\;limit}{2} \\[5ex] E = \dfrac{28 - 16}{2} \\[5ex] E = 6 $
(12.) Determine whether the interpretation is valid or invalid.
Complaints about poor service led the Department of Motor Vehicles (DMV) of a certain State to investigate the wait times at a local branch.
During one week, DMV employees randomly asked 50 people leaving this branch how long they had to wait in line.
Using the responses, they found a 99% confidence interval of (39.3, 42.1) for the mean wait time at the DMV branch during that week (in minutes).
At most 1% of people leaving this branch during the week waited less than 39.3 or more than 42.1 minutes.


The interpretation is invalid.
By chance, the survey might have included people who got stuck in long lines and had to wait significantly more than what is average.
(13.) An infomercial claimed that a woman drove 6 hours without oil, thanks to an engine treatment.
To determine the effectiveness of engine treatment, a company in the City of Truth or Consequences, New Mexico tested engines in which they added the treatment to the motor oil, ran the engines, drained the oil, and then determined the time until the engines seized.
The times (in minutes) are listed as shown:

$13.15$ $15.05$ $13.62$ $16.64$ $17.04$ $16.66$
$14.41$ $15.10$ $17.21$ $17.87$ $24.04$ $14.39$

(a.) Determine the point estimate of the mean amount of time.
(b.) What is the biggest flaw of using a point estimate to determine the population mean?
(c.) Construct a 95% confidence interval of the population mean.
(d.) Interpret your result.


Waiting Times, $x$ Frequencies, $f$ $f * x$ $x - \bar{x}$ $(x - \bar{x})^2$ $f(x - \bar{x})^2$
$13.15$ $1$ $13.15$ $-3.115$ $9.703225$ $9.703225$
$15.05$ $1$ $15.05$ $-1.215$ $1.476225$ $1.476225$
$13.62$ $1$ $13.62$ $-2.645$ $6.996025$ $6.996025$
$16.64$ $1$ $16.64$ $0.375$ $0.140625$ $0.140625$
$17.04$ $1$ $17.04$ $0.775$ $0.600625$ $0.600625$
$16.66$ $1$ $16.66$ $0.395$ $0.156025$ $0.156025$
$14.41$ $1$ $14.41$ $-1.855$ $3.441025$ $3.441025$
$15.10$ $1$ $15.10$ $-1.165$ $1.357225$ $1.357225$
$17.21$ $1$ $17.21$ $0.945$ $0.893025$ $0.893025$
$17.87$ $1$ $17.87$ $1.605$ $2.576025$ $2.576025$
$24.04$ $1$ $24.04$ $7.775$ $60.450625$ $60.450625$
$14.39$ $1$ $14.39$ $-1.875$ $3.515625$ $3.515625$
$\Sigma f = 12$ $\Sigma fx = 195.18$ $\Sigma f(x - \bar{x})^2 = 91.3063$


$ (a.) \\[3ex] \bar{x} = \dfrac{\Sigma fx}{\Sigma f} \\[5ex] \bar{x} = \dfrac{195.18}{12} \\[5ex] \bar{x} = 16.265 \\[3ex] $ The point estimate of the population mean is the sample mean
The point estimate of the population mean = $16.265$ minutes

(b.) The flaw in using the point estimate is that it gives only a single value estimate of the population mean as compared to the interval estimate which gives a range of values.

$ \Sigma f - 1 = 12 - 1 = 11 \\[3ex] s = \sqrt{\dfrac{\Sigma f(x - \bar{x})^2}{\Sigma f - 1}} \\[5ex] s = \sqrt{\dfrac{91.3063}{11}} \\[5ex] s = \sqrt{8.30057273} \\[3ex] s = 2.88107146 \\[3ex] CL = 95\% = 0.95 \\[3ex] \alpha = 1 - CL \\[3ex] \alpha = 1 - 0.95 \\[3ex] \alpha = 0.05 \\[3ex] \dfrac{\alpha}{2} = \dfrac{0.05}{2} = 0.025 \\[5ex] $ The population standard deviation was not given
So, we have to use the $t$ distribution

$ df = n - 1 = 12 - 1 = 11 \\[3ex] t_{\dfrac{\alpha}{2}} = t_{0.025} = 2.1009 \\[5ex] E = \dfrac{s * t_{\dfrac{\alpha}{2}}}{\sqrt{n}} \\[7ex] E = \dfrac{2.88107146 * 2.1009}{\sqrt{12}} \\[5ex] E = \dfrac{6.05284303}{3.46410162} \\[5ex] E = 1.74730527 \\[5ex] 95\%\:\: CI \\[3ex] = \bar{x} \pm E \\[3ex] = 16.265 \pm 1.74730527 \\[3ex] = 14.5176947 \:\:and\:\: 18.0123053 \\[3ex] \therefore 95\%\:\:CI = 14.52 \lt \mu \lt 18.01 \\[3ex] $ We are 95% confident that the population mean is within the margin of error of the sample mean of 16.265
We are 95% confident that the population mean is between 14.52 and 18.01
(14.) Determine whether the interpretation is valid or invalid.
A store owner wants to check whether her competitor carries larger produce than she does.
She purchased 100 randomly selected kiwis from her competitor and weighed them.
The owner found a 99% confidence interval of (40.9, 41.9) for the mean weight of kiwis from her competitor (in grams).
If 100 more samples are taken (with elements chosen randomly and independently), it is expected that the mean weight of kiwis from her competitor would be in 99 of the computed 99% confidence intervals.


The interpretation is valid.
For 99% of random samples, the 99% confidence interval will contain the population mean.
This means that if 100 more random samples are taken, it is expected that the calculated interval for 99 of them will contain the population mean.
(15.)

(16.) An IQ (Intelligence Quotient) test is designed so that the mean is 100 and the standard deviation is 21 for the population of normal adults.
Calculate the sample size necessary to estimate the mean IQ score of statistics students such that it can be said with 90% confidence that the sample mean is within 9 IQ points of the true mean.


$ \mu = 100 \\[3ex] \sigma = 21 \\[3ex] E = 9 \\[3ex] CL = 90\% = 0.9 \\[3ex] \alpha = 1 - CL \\[3ex] \alpha = 1 - 0.9 \\[3ex] \alpha = 0.1 \\[3ex] \dfrac{\alpha}{2} = \dfrac{0.1}{2} = 0.05 \\[5ex] $ We shall use the z distribution in this case because we were given the population standard deviation

$ z_{\dfrac{\alpha}{2}} = 1.6449 \\[7ex] n = \left(\dfrac{\sigma * z_{\dfrac{\alpha}{2}}}{E}\right)^2 \\[9ex] n = \left(\dfrac{21 * 1.6449}{9}\right)^2 \\[5ex] n = 14.73101161 \\[3ex] n \approx 15\;adults \\[3ex] $ To estimate the mean IQ score of statistics students such that it can be said with 90% confidence that the sample mean is within 9 IQ points of the true mean, at least 15 students are needed.
(17.)

(18.) Determine whether the interpretation is valid or invalid.
A physical trainer is designing a fitness program for middle-aged men.
She asked a random sample of 175 men in their 40s to report how far they could jump in centimeters from a standstill.
The trainer computed a 99% confidence interval of (121.9, 127.1) for the mean jump distance for men in their 40s.
If the trainer takes another random sample, there is a 1% chance that the mean jump distance for men in their 40s will not be in the new sample's 99% confidence interval.


The interpretation is valid.
For 99% of random samples, the 99% confidence interval will contain the population mean.
So, for the other 1% of random samples, the 99% confidence interval will not contain the population mean.
This means that if the sample were repeated, there would be a 1% chance the confidence interval for that sample would not contain the population mean.
(19.) A random sample of 10 colleges in the U.S State of Arizona showed the mean graduation rate of high school students in the past 4 years as 44.6% with a margin of error of 5% using a 5% level of significance.
The distribution of the graduation rates is a normal distribution.

(a.) Interpret the confidence interval.

(b.) Hate News Network reported the population mean percentage as 28.6%.
Should the Hate News Network report be rejected?

(c.) Love News Network study reported the population mean percentage as 43.5%.
Should the Love News Network report be rejected?


$ \alpha = 5\% = 0.5 \\[3ex] CL = 1 - \alpha = 1 - 0.05 = 0.95 = 95\% \\[3ex] \bar{x} = 43.6\% \\[3ex] E = 5\% \\[5ex] \underline{Confidence\;\;Interval\;\;for\;\;the\;\;Population\;\;Mean} \\[3ex] \bar{x} - E \lt \mu \lt \bar{x} + E \\[3ex] 44.6\% - 5\% \lt \mu \lt 44.6\% + 5\% \\[3ex] 39.6\% \lt \mu \lt 49.6\% \\[3ex] $ (a.) We are 95% confident that the population mean graduation rate is between 39.6% and 49.6%

(b.) Reject the Hate News Network report because 28.6% is not in the confidence interval.
It is not plausible the population graduation rate is 28.6%.

(c.) Do not reject the Love News Network because 43.5% is in the confidence interval.
It is plausible the population mean graduation rate is 43.5%.
(20.) Determine whether the interpretation is valid or invalid.
During a recent exhibit on the physics of football, volunteers at the local science museum conducted a survey of 750 randomly chosen visitors.
The survey included questions about attendance at sporting events.
The volunteers calculated a 90% confidence interval of (7.9, 8.1) for the mean number of sporting events museum visitors attended last year.
The average number of sporting events visitors in the survey went to last year is between 7.9 and 8.1.


The interpretation is valid.
The confidence interval (7.9, 8.1) contains the sample mean.
In other words, the average number of sporting events visitors in the survey went to last year is between 7.9 and 8.1.


Top


(21.) Paul randomly selected four bags of oranges from many bags of oranges.
Each bag was labeled 10 pounds.
However, he decided to weigh each bag.
The weights of the bags are: 9.2, 9.2, 9.3, and 9.7 pounds.

(a.) Assuming a normal distribution of the weights of all the bags, calculate the 95% confidence interval for the mean weight of all the bags of oranges.
(Round to 3 decimal places.)

(b.) Interpret the confidence level.

(c.) Interpret the confidence interval.


$ \underline{Samples}: \\[3ex] 9.2, 9.2, 9.3, 9.7 \\[3ex] n = 4 \\[3ex] \bar{x} = 9.35 \\[3ex] s = 0.2380476143 \\[3ex] $ Because of the sample standard deviation, we shall use the t distribution table.

$ df = n - 1 \\[3ex] df = 4 - 1 \\[3ex] df = 3 \\[3ex] CL = 95\% = 0.95 \\[3ex] \alpha = 1 - CL \\[3ex] \alpha = 1 - 0.95 \\[3ex] \alpha = 0.05 \\[3ex] \dfrac{\alpha}{2} = \dfrac{0.05}{2} = 0.025 \\[5ex] t_{\dfrac{\alpha}{2}} = 3.1824 \\[5ex] E = \dfrac{s * t_{\dfrac{\alpha}{2}}}{\sqrt{n}} \\[7ex] E = \dfrac{0.2380476143 * 3.1824}{\sqrt{4}} \\[5ex] E = 0.3787813639 \\[5ex] 95\%\;\;CI \\[3ex] = \bar{x} \pm E \\[3ex] = 9.35 \pm 0.3787813639 \\[3ex] = 8.971218636 \lt \mu \lt 9.728781364 \\[3ex] \approx 8.971 \lt \mu \lt 9.729 \\[3ex] $ (b.) We are 95% confident the population mean of the bags is between 8.971 pounds and 9.729 pounds.

(c.) In about 95% of all the samples of the bags of oranges, the confidence interval will contain the population mean of (8.971, 9.729) pounds.
(22.) Determine whether the interpretation is valid or invalid.
Game reviewers complained extensively about how a gaming company's recent game was too short.
To ensure this does not happen again, the gaming company gave a pre-release copy of its new game to 100 randomly selected gamers.
Each gamer was asked to note his or her play-through time.
The gaming company found a 90% confidence interval of (214.6, 242) for the mean play-through time for all gamers in minutes.
There is a 10% chance that the mean play-through time for all gamers (in minutes) is not in the interval (214.6, 242).


The interpretation is invalid.
The population mean is the average play-through time in minutes for all gamers, not just the ones in the sample.
(23.)

(24.) Determine whether the interpretation is valid or invalid.
An epidemiologist interested in how the common cold impacts health clinics.
She asked 275 randomly selected clinics across a certain State for their patient data from one specific month.
For each clinic, she looked at the number of patients who came in with a common cold that month.
She determined a 90% confidence interval of (43.5, 46.9) for the mean number of patients with a common cold who visited clinics in the State that month.
If she takes another random sample, there is a 90% chance that the mean number of patients with a common cold who visited clinics in the State that month will be in the new sample's 90% confidence interval.


The interpretation is valid.
For 90% of random samples, the 90% confidence interval will contain the population mean.
This means that if the sample were repeated, there would be a 90% chance the confidence interval for that sample would contain the population mean.
(25.)

(26.) Determine whether the interpretation is valid or invalid.
Executives at a certain public park would like to know what age group to target with their advertisements.
To begin, the executives collected the ages of 400 randomly selected attendees in one month.
Analysis of the study produced a 99% confidence interval of (13.2, 14.2) for the mean age of attendees at the park.
If the executives take more same-sized samples, then 99% of the attendees in each sample will be between 13.2 and 14.2 years old.


The interpretation is invalid.
By chance, the original sample might have included only attendees significantly older than what is average.
If this were the case, the confidence interval (13.2, 14.2) would exclude much of the population.
As a result, in most samples it would not be the case that 99% of sampled attended would be between 13.2 and 14.2 years old.
(27.)

(28.) Determine whether the interpretation is valid or invalid.
Botanists are concerned that rising temperatures are impeding the growth of trees in a certain National Forest.
To investigate, they measured the heights of a random sample of 50 mature birch trees to the nearest tenth of a meter.
They calculated a 95% confidence interval of (11.7, 13.9) for the mean height of mature birch trees in the National Forest.
If 100 more samples are taken (with elements chosen randomly and independently), it is expected that the mean height of mature birch trees in the forest would be in 95 of the computed 95% confidence intervals.


The interpretation is valid.
The population mean is the average height of all mature birch trees in the National Forest, not just the ones in the sample.
For 95% of random samples, the 95% confidence interval will contain the population mean.
This means that if 100 more random samples are taken, it is expected that the calculated interval for 95 of them will contain the population mean.
(29.)

(30.) Chastity wanted to determine the population average of the heights of residents in the town of Fidelity, Missouri (Hmmm...who are they loyal to?)
She measured the heights of a sample of the residents, and intend to find a confidence interval for the average height of the population of the residents.
Which of these confidence levels, 95%, or 99% will result in the confidence interval giving a more accurate estimate of the population mean height?


The 95% confidence level will give a more accurate estimate of the population mean height because the margin of error will be smaller for that confidence level.
(31.)

(32.) Given these values:

$ \bar{x} = 37 \\[3ex] n = 16 \\[3ex] \sigma = 6 \\[3ex] CL = 95\% \\[3ex] $ Calculate and interpret the margin of error.
Round to two decimal places.


$ \alpha = 1 - CL \\[3ex] \alpha = 1 - 0.95 \\[3ex] \alpha = 0.05 \\[3ex] \dfrac{\alpha}{2} = \dfrac{0.05}{2} = 0.025 \\[5ex] $ We shall use the z-distribution table because the population standard deviation was given.

$ z_{\dfrac{\alpha}{2}} = 1.96 \\[7ex] E = \dfrac{\sigma * z_{\dfrac{\alpha}{2}}}{\sqrt{n}} \\[7ex] E = \dfrac{6 * 1.96}{\sqrt{16}} \\[5ex] E = 2.94 \\[5ex] 95\%\;\;CI \\[3ex] = \bar{x} \pm E \\[3ex] = 37 \pm 2.94 \\[3ex] = 34.06 \lt \mu \lt 39.94 \\[3ex] $ We are 95% confident that the population mean is within the margin of error of the sample mean of 37
(33.) A simple random sample is drawn from a normally distributed population.
The sample mean is 109 and the sample standard deviation is 10.
(Round to one decimal place as needed.)

(a.) Construct a 98% confidence interval about the population mean if the sample size is 20.

(b.) Construct a 98% confidence interval about the population mean if the sample size is 24.

(c.) Construct a 99% confidence interval about the population mean if the sample size is 20.

(d.) What are your observations regarding the:
(i.) sample size and the margin of error?
(ii.) Confidence interval and the margin of error?

(e.) Assume the population was not normally distributed, should we compute the confidence interval?
Why or why not?


$ \bar{x} = 109 \\[3ex] s = 10 \\[3ex] $ We shall use the t distribution table because the sample standard deviation was given.

$ (a.) \\[3ex] CL = 98\% = 0.98 \\[3ex] \alpha = 1 - 0.98 \\[3ex] \alpha = 0.02 \\[3ex] \dfrac{\alpha}{2} = \dfrac{0.02}{2} = 0.01 \\[5ex] n = 20 \\[3ex] df = n - 1 \\[3ex] df = 20 - 1 \\[3ex] df = 19 \\[3ex] t_{\dfrac{\alpha}{2}} = 2.5395 \\[7ex] E = \dfrac{s * t_{\dfrac{\alpha}{2}}}{\sqrt{n}} \\[7ex] E = \dfrac{10 * 2.5395}{\sqrt{20}} \\[5ex] E = 5.678494629 \\[3ex] 98\%\;\;CI \\[3ex] = \bar{x} \pm E \\[3ex] = 109 \pm 5.678494629 \\[3ex] = 103.3215054 \lt \mu \lt 114.6784946 \\[3ex] \approx 103.3 \lt \mu \lt 114.7 \\[5ex] (b.) \\[3ex] CL = 98\% = 0.98 \\[3ex] \alpha = 1 - 0.98 \\[3ex] \alpha = 0.02 \\[3ex] \dfrac{\alpha}{2} = \dfrac{0.02}{2} = 0.01 \\[5ex] n = 24 \\[3ex] df = n - 1 \\[3ex] df = 24 - 1 \\[3ex] df = 23 \\[3ex] t_{\dfrac{\alpha}{2}} = 2.5395 \\[7ex] E = \dfrac{s * t_{\dfrac{\alpha}{2}}}{\sqrt{n}} \\[7ex] E = \dfrac{10 * 2.5395}{\sqrt{24}} \\[5ex] E = 5.183732668 \\[3ex] 98\%\;\;CI \\[3ex] = \bar{x} \pm E \\[3ex] = 109 \pm 5.183732668 \\[3ex] = 103.8162673 \lt \mu \lt 114.1837327 \\[3ex] \approx 103.8 \lt \mu \lt 114.2 \\[5ex] (c.) \\[3ex] CL = 99\% = 0.99 \\[3ex] \alpha = 1 - 0.99 \\[3ex] \alpha = 0.01 \\[3ex] \dfrac{\alpha}{2} = \dfrac{0.01}{2} = 0.005 \\[5ex] n = 20 \\[3ex] df = n - 1 \\[3ex] df = 20 - 1 \\[3ex] df = 19 \\[3ex] t_{\dfrac{\alpha}{2}} = 2.8609 \\[7ex] E = \dfrac{s * t_{\dfrac{\alpha}{2}}}{\sqrt{n}} \\[7ex] E = \dfrac{10 * 2.8609}{\sqrt{20}} \\[5ex] E = 6.397166877 \\[3ex] 99\%\;\;CI \\[3ex] = \bar{x} \pm E \\[3ex] = 109 \pm 6.397166877 \\[3ex] = 102.6028331 \lt \mu \lt 115.3971669 \\[3ex] \approx 102.6 \lt \mu \lt 115.4 \\[3ex] $ (d.) (i.) As the sample size increases, the margin of error decreases.
(ii.) As the level of confidence increases, the margin of error increases.

(e.) If the population is not normally distributed, the confidence interval should not be computed.
The requirement for computing the confidence interval about a population mean is that the population should be normally distributed, or the sample size should be greater than 30.
(34.)


(35.)

(36.)


(37.)

(38.) Determine whether the interpretation is valid or invalid.
A man is convinced that the German novel he just finished reading has some of the longest sentences he has ever encountered.
To prove this to his friends, he randomly selected 50 sentences in the novel and noted the number of words in each.
He found a 95% confidence interval of (20.2, 24.2) for the mean number of words in sentences from the novel.
If 100 more samples are taken (with elements chosen randomly and independently), it is expected that for 95 of the samples, the sample mean will be between 20.2 and 24.2.


This is invalid.
By chance, the original sample might have included only elaborate sentences significantly longer than what is average for the novel.
(39.)

(40.)


Top


(41.)

(42.) In calculating the confidence interval for a random sample of the grade point averages (GPAs) of 25 students.
The first interval was (2.50, 3.20) and the second interval was (2.60, 3.10).
One of them is a 90% interval and one is a 95% interval.

(a.) Which one is which?
How do you know?

(b.) Suppose the sample size is increased from 25 to 100.
Comment on the width, standard error, and the margin of error for the first interval.


(a.) The first interval, (2.50, 3.20) is the 95% interval and the second interval, (2.60, 3.10) is the 90% interval.
This is because the higher the confidence level, the wider the confidence interval.

$ 3.20 - 2.50 \gt 3.10 - 2.60 \\[3ex] 0.7 \gt 0.5 \\[3ex] $ (b.) The 95% interval with the sample size of 100 would result in a narrower width than the 95% interval with the sample size of 25.
This is because a larger sample size provides a smaller standard error and a smaller margin of error at the same confidence level.
(43.) A clinical trial was conducted to test the effectiveness of a drug for treating insomnia in old patients.
Before treatment, 19 patients had a mean wake time of 104.0 minutes.
After treatment, the 19 patients had a mean wake time of 79.6 minutes and a standard deviation of 44.2 minutes.
Assume the 19 patients to be from a normally distributed population.
(Round to a decimal place.)

(a.) Construct a 95% confidence interval estimate of the mean wake time for a population with drug treatments.
(b.) What does the result suggest about the mean wake time of 104.0 minutes before the treatment?
(c.) Does the drug appear to be effective?


$ (a.) \\[3ex] n = 19 \\[3ex] \bar{x} = 79.6 \\[3ex] s = 44.2 \\[3ex] CL = 95\% = 0.95 \\[3ex] \alpha = 1 - 0.95 \\[3ex] \alpha = 0.05 \\[3ex] \dfrac{\alpha}{2} = \dfrac{0.05}{2} = 0.025 \\[5ex] $ We shall use the t distribution in this case because we were given the sample standard deviation

$ df = n = 1 \\[3ex] df = 19 - 1 \\[3ex] df = 18 \\[3ex] t_{\dfrac{\alpha}{2}} = 2.1009 \\[7ex] E = \dfrac{s * t_{\dfrac{\alpha}{2}}}{\sqrt{n}} \\[7ex] E = \dfrac{44.2 * 2.1009}{\sqrt{19}} \\[5ex] E = 21.30349458 \\[3ex] 95\%\;\;CI \\[3ex] = \bar{x} \pm E \\[3ex] = 79.6 \pm 21.30349458 \\[3ex] = 58.29650542 \lt \mu \lt 100.9034946 \\[3ex] \approx 58.3 \lt \mu \lt 100.9 \\[3ex] $ (b.)
The confidence interval does not contain the mean wake time of 104.0 minutes before the treatment.
The mean wake time before the treatment for the 19 patients is 104.0 minutes.
The mean wake time after the treatment for the population that was treated with the drug is between 58.3 minutes and 100.9 minutes.
Both values are less than 104.0 minutes.
(c.)
This means that the drug had an effect.
The drug appears to be effective.
(44.)


(45.)

(46.)


(47.)

(48.) A statistician in the town of Pray, Montana (Is every resident in that town a Prayer Warrior?) wanted to estimate the average blood alcohol concentration (BAC) for drivers involved in fatal accidents who have positive BAC values.
He has been asking the state residents to pray, rather than drink.
Montana was one of the states with the highest percentage of drunken drivers in 2014. (24/7 Wall St.: https://247wallst.com/special-report/2014/04/25/states-with-the-most-drunk-driving/)
He randomly selected the records from 1000 such drivers in 2014 and determined the sample mean BAC to be 0.15 g/dL with a standard deviation of 0.06 g/dL.
A histogram of blood alcohol concentrations in fatal accidents shows that BACs are highly skewed right.
Why is a large sample size required to construct a confidence interval for the mean BAC of fatal crashes with a positive BAC?


A large sample size is needed because the distribution of blood alcohol concentrations is not normally distributed.
It is skewed right.
(49.)

(50.)


(51.)

(52.) The pulse rates of 141 randomly selected adult males in the town of Roaches, Illinois (Wow... guess they have more roaches than the Big Apple ) vary from a low of 43 bpm (beats per minute) to a high of 127 bpm.
Calculate the minimum sample size required to estimate the mean pulse rate of adult males in the town using a 90% confidence level that the sample mean is within 3 bpm of the population mean.


$ Max = 127 \\[3ex] Min = 43 \\[3ex] \underline{Range\;\;Rule\;\;of\;\;Thumb} \\[3ex] s = \dfrac{Max - Min}{4} \\[5ex] s = \dfrac{127 - 43}{4} \\[5ex] s = 21 \\[3ex] E = 3 \\[3ex] CL = 90\% = 0.9 \\[3ex] \alpha = 1 - CL \\[3ex] \alpha = 1 - 0.9 \\[3ex] \alpha = 0.1 \\[3ex] \dfrac{\alpha}{2} = \dfrac{0.1}{2} = 0.05 \\[5ex] n = 141 \\[3ex] df = n - 1 \\[3ex] df = 141 - 1 \\[3ex] df = 140 \\[3ex] $ We shall use the t distribution in this case because of the sample standard deviation

$ t_{\dfrac{\alpha}{2}} = 1.6558 \\[7ex] n = \left(\dfrac{s * t_{\dfrac{\alpha}{2}}}{E}\right)^2 \\[9ex] n = \left(\dfrac{21 * 1.6558}{3}\right)^2 \\[5ex] n = 134.3420084 \\[3ex] n \approx 135\;adult\;\;males \\[3ex] $ To estimate the mean pulse rate of adult males in the town using a 90% confidence level that the sample mean is within 3 bpm of the population mean, a minimum of 135 adult males are needed.

Student: Why is it not 134 rather than 135 adult males?
Teacher: Whenever we deal with the number of living beings, we always round up to the nearest integer.
Unless specified otherwise, we do not do the normal rounding.
(53.)

(54.)


(55.)

(56.)


(57.)

(58.)


(59.)

(60.)


Top


(61.)

(62.)


(63.)

(64.)