Inferential Statistics Project


Inferential Statistics

Hypothesis Testing

Samuel Dominic Chukwuemeka (SamDom For Peace)
MTH 245 (Statistics I) students are required to do the Inferential Statistics project. According to the Math Department at BRCC, they are required to use a free software. As at today: 07/15/2023; the only free statistical software is R/RStudio
MTH 155 (Statistical Reasoning) students may choose to do the Descriptive Statistics project or the Inferential Statistics project. If they choose to do the inferential statistics project, they may use any statistical software.

The inferential statistics project is designed to:
(1.) Meet the requirements of the VCCS detailed course outline for MTH 245
VCCS Outline Requirement

(2.) Draw statistical inferences from a sample onto a population. This is achieved by any of these tasks:
(a.) Estimate a population parameter using a sample statistic.
(b.) Conduct a hypothesis test of a population parameter using a sample statistic.

General Project Requirements

(1.) Data (Dataset): What dataset(s) should you use?
There are four approved ways to get the dataset(s).
Use any or combination of them.

(a.) RStudio Datasets:
You may use any of the applicable built-in datasets from RStudio.

(b.) Textbook (eBook) Datasets
You may use any of the applicable datasets from your eBook
eBook Datasets: 1
eBook Datasets: 2

eBook Datasets: 3

eBook Datasets: 4

eBook Datasets: 5

eBook Datasets: 6

(c.) MyLab Math (MLM) Datasets
You may use any of the applicable datasets from your MLM assignments if the sample size is at least 30. (n ≥ 30)

(d.) Datasets from the U.S Government website: United States Government's Open Data: Datasets
You may use any of the applicable open datasets from the U.S government.

(e.) Data Collection from my Students. (This option is for onsite (traditional/in-class) students only.)
Please see me in the Office during Office Hours so we can discuss the data collection methods and other requirements.

Any other dataset besides the ones mentioned should be pre-approved by me.


(2.) Parameters
At least two parameters are required.
Please choose any two parameters.
If you choose to do more than two parameters, the best two would be used for your project grade.
The parameters to be estimated (Inferential Statistics) or tested (Hypothesis Testing) are:
(a.) Population Mean (Estimate or Test)
(b.) Population Proportion (Estimate or Test)
(c.) Population Variance (Estimate or Test)
(d.) Population Standard Deviation (Estimate or Test)
(e.) Correlation (Test)

The data values for the variable(s) could be from one sample or from more than one sample. Please ensure you specify the number of samples.
Please review the examples/samples I did for you.

Inferential Statistics
(a.) Using Sample Mean to estimate Population Mean
(b.) Using Sample Proportion to estimate Population Proportion
(c.) Using Sample Variance to estimate Population Variance
(d.) Using Sample Standard Deviation to estimate Population Standard Deviation

Hypothesis Testing
(a.) Hypothesis Test about a Population Proportion
(b.) Hypothesis Test about a Population Mean
(c.) Hypothesis Test about a Population Variance
(d.) Hypothesis Test about a Population Standard Deviation
(e.) Hypothesis Test about a Correlation
Please NOTE: For any Hypothesis Tests, at least two approaches are required.


(3.) This is an individual project.
You may collaborate with one another. However, it is not a group project.
No two students should use the same dataset and same variable(s) because there are many datasets available for you.
I understand you are not Computer Science/Programming students. So, I spent time to write several notes and codes on R/RStudio.
Also, I provided you with several resources which I cited as references.
Be it as it may, I am here to help you. You have my number. Feel free to text me anytime. We can arrange Zoom sessions so I share my screen and work you through any questions you have. Please do this as soon as possible. Keep the due dates in mind.

(a.) Please submit the two datasets (names of the datasets including the sources) and at least two parameters that you intend to estimate/test in the Projects: Datasets and Parameters forum in the Canvas course. I shall review and respond.

(b.) Once I give you the approval, please send your draft to me via email (if you prefer my review to be seen by you alone) or submit your draft in the Projects: Drafts forum in the Canvas course (if you do not mind your colleagues reading my review). I shall review and respond.

(c.) When everything is fine (after you make changes as applicable based on my feedback), please submit your work in the appropriate area (Projects forum) of the Canvas course.
Only projects submitted in the appropriate area (Projects forum) of the Canvas course are graded.
Draft projects are not graded. In other words, projects submitted via email and/or in the Projects: Drafts forum are not graded because they are drafts. Submitting drafts is highly recommended. If your professor gives you an opportunity to submit a draft, please use that opportunity.
Submitting drafts is not required. It is highly recommended because I want to give you the opportunity to do your project very well and make an excellent grade in it.


(4.) (a.) The deliverables for the project draft are: Google Docs or Micrsoft Office Word containing the minimum required information and clear screenshots of codes and results.

(b.) The deliverables for the project are:
(I.) Google Docs or Micrsoft Office Word containing the minimum required information and clear screenshots of codes and results.
(II.) The R project folder (that contains all the files). Please use an appropriate name for the project.
Zip the document and the folder and submit as a zip folder in the Projects forum of the Canvas course. (III.) Please see an example guide for the required information.
You may choose to use a table format or other appropriate format that contains the minimum required information.


(5.) (a.) For the RStudio screenshots and RStudio settings, please set the font size in the editor to at least 14. Also, use a transparent background (default as is)
In other words, please do not change the theme. If you do need to change the theme, use a light/transparent theme.
Change only the font size to at least 14.

(b.) As a BRCC/VCCS student, you have access to Microsoft Office suite of apps.
(a.) You can download and install these apps on your laptop/desktop. Please contact the IT/Tech support in your college for assistance if you do not know.
You also have access to Google apps.

(c.) For all English terms (entire project): use Times New Roman; font size of 14; line spacing of 1.5
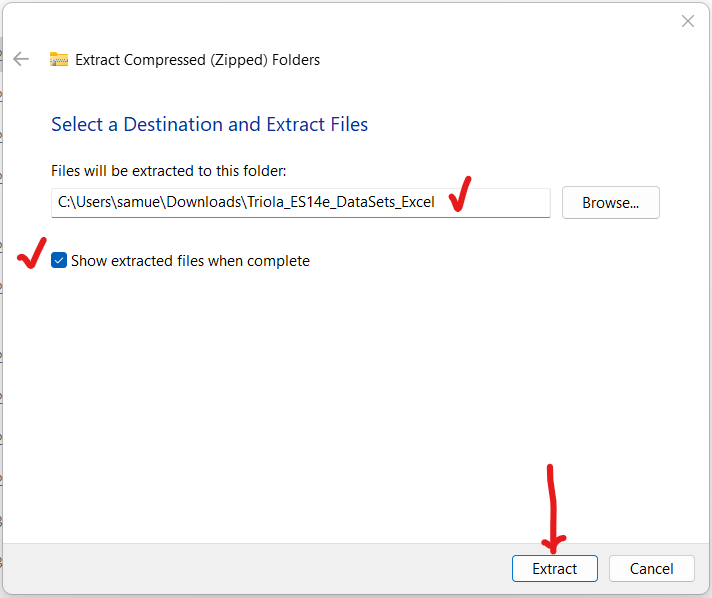
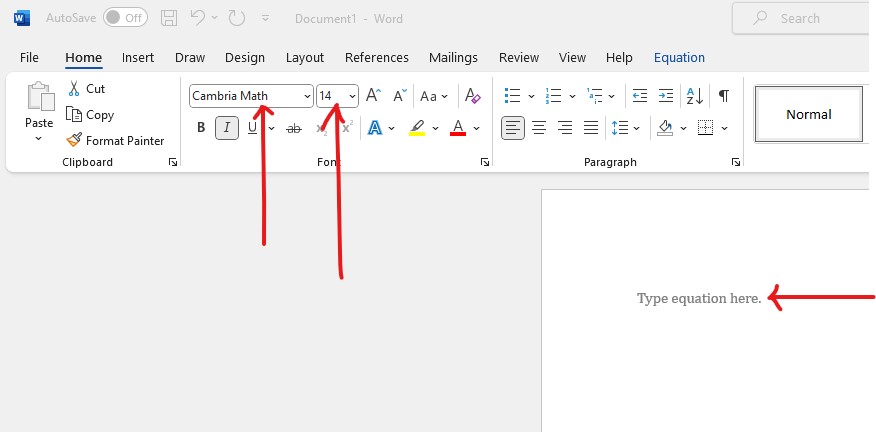
first step

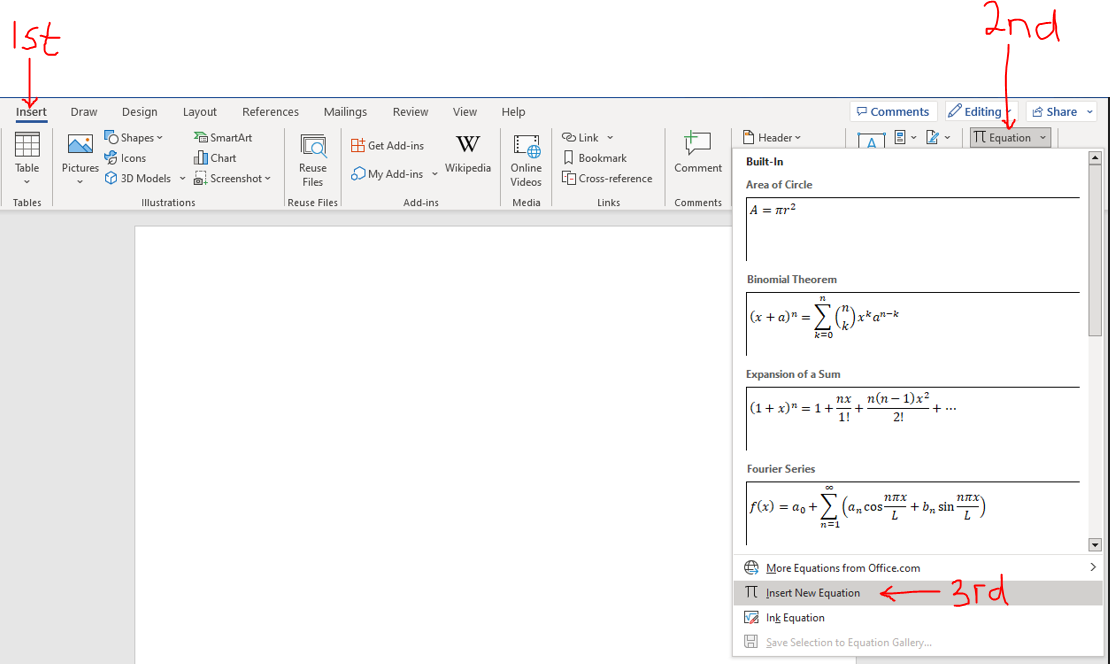
(d.) For all Math terms: symbols, variables, numbers, formulas, expressions, equations and fractions among others, please use the Math Equation Editor.
(i.) Set the font to Cambria Math; font size of 14; and align accordingly
(ii.) Insert a space after each each equation as applicable. Just make a good work that is organized and spacious.
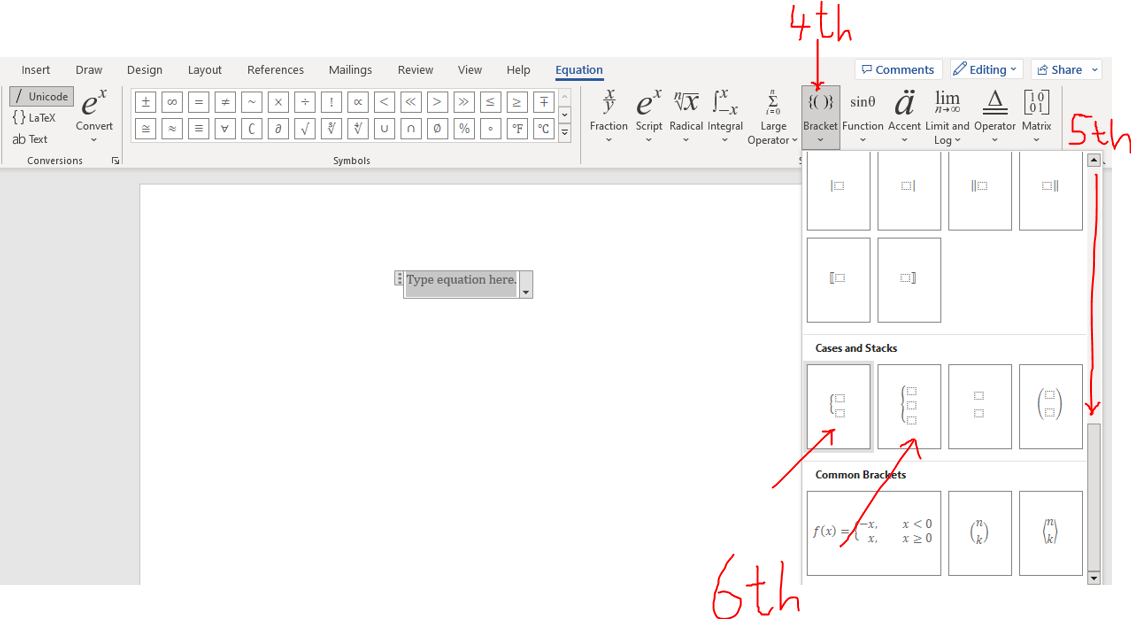
(iii.) Align the functions in each piece of the piecewise function accordingly.

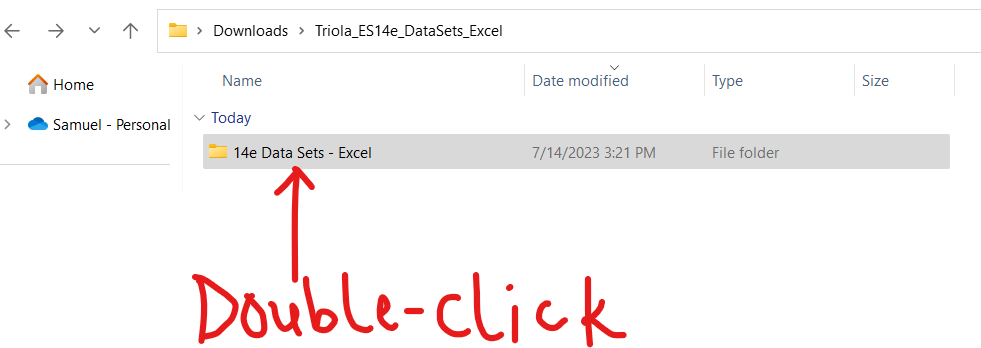
second step

third step

fourth step

(e.) Include page numbers. You may include at the top of the pages or at the bottom of the pages but not both.
fifth step


Top

Example Guide (Inferential Statistics Project)

Name: Your name
Date: The date
Instructor: Samuel Chukwuemeka
Project: (Please choose one)
Inferential Statistics
or
Hypothesis Testing
1st Dataset: (Please write the name of the dataset and describe it.) 1st Source: (Please write your source)
1st Parameter: (Please choose one)
(a.) Population Mean (Estimating or Testing)
(b.) Population Proportion (Estimating or Testing)
(c.) Population Variance (Estimating or Testing)
(d.) Population Standard Deviation (Estimating or Testing)
(e.) Correlation (Testing)

(1.) Specify the sample, number of unique sample type(s), and the sample size.
(2.) Write the population.
(3.) Write the type of estimation or type of test.
(4.) Verify the requirements/conditions for your estimation/test or assume that requirements/conditions are satisfied.
(5.) Make reliable assumptions for any missing requirement and support it with sources if possible.
(6.) State the reasons for your estimation/test.
(7.) Write and run the codes for your estimation/test. For hypothesis tests, at least two approaches are required.
(8.) Write comments in your codes accordingly.
(9.) Explain the results.
(10.) Interpret the results in the context of the specific objectives.
2nd Dataset: (Please write the name of the dataset and describe it) 2nd Source: (Please write your source)
2nd Parameter: (Please choose one)
(a.) Population Mean (Estimating or Testing)
(b.) Population Proportion (Estimating or Testing)
(c.) Population Variance (Estimating or Testing)
(d.) Population Standard Deviation (Estimating or Testing)
(e.) Correlation (Testing)

(1.) Specify the sample, number of unique sample type(s), and the sample size.
(2.) Write the population.
(3.) Write the type of estimation or type of test.
(4.) Verify the requirements/conditions for your estimation/test or assume that requirements/conditions are satisfied.
(5.) Make reliable assumptions for any missing requirement and support it with sources if possible.
(6.) State the reasons for your estimation/test.
(7.) Write and run the codes for your estimation/test. For hypothesis tests, at least two approaches are required.
(8.) Write comments in your codes accordingly.
(9.) Explain the results.
(10.) Interpret the results in the context of the specific objectives.
Objectives: (Please write specific objectives)
(1.)
(2.)
(3.)
(4.)
(5.)
References: Please cite your sources accordingly. Indicate the citation format.


Top

Inferential Statistics: Population Proportion: One Sample

Dataset: 2011 D75 School Surveys | NYC (New York City) Open Data
Source: Data.gov: The Home of the U.S. Government's Open Data
General Description: (Taken from: https://data.cityofnewyork.us/Education/2011-D75-School-Surveys/t9nb-zfe4)
NYC Department of Education 2011 District 75 School Surveys.
Every year, all parents, all teachers, and students in grades 6 – 12 take the NYC School Survey.
The survey ranks among the largest surveys of any kind ever conducted nationally.
Survey results provide insight into a school's learning environment and contribute a measure of diversification that goes beyond test scores on the Progress Report.
NYC School Survey results contribute 10% - 15% of a school's Progress Report grade (the exact contribution to the Progress Report is dependant on school type).
Survey questions assess the community's opinions on academic expectations, communication, engagement, and safety and respect.
School leaders can use survey results to better understand their own school's strengths and target areas for improvement.

Specific Description:
The data set is the NYC Department of Education 2011 District 75 School Surveys.
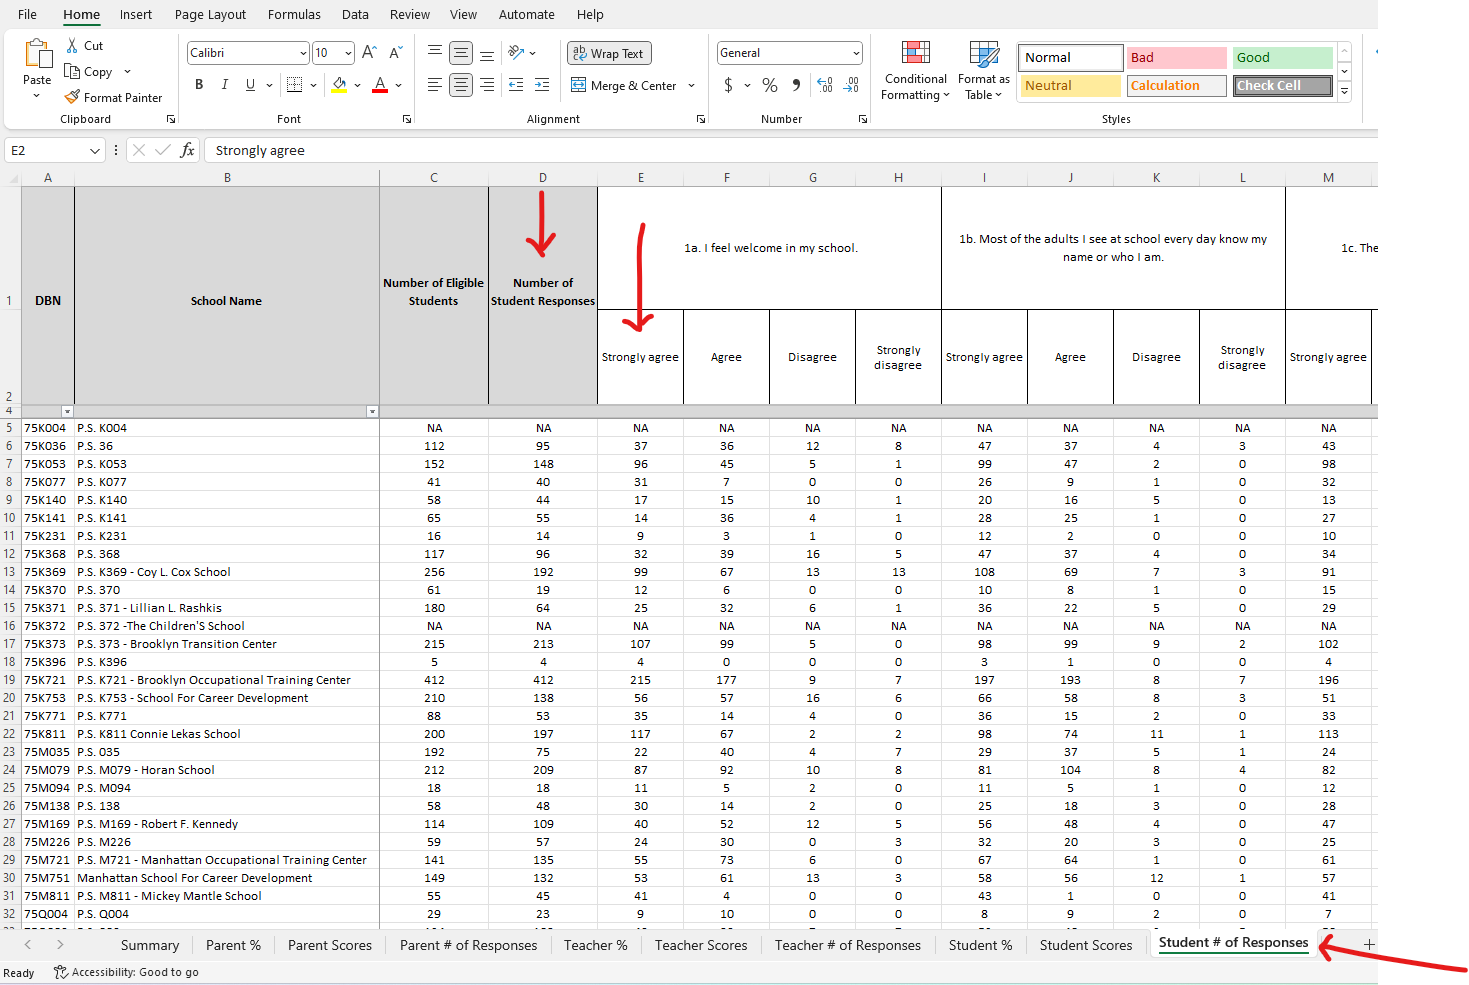
Specifically, we are interested in determining the proportion of students who Strongly agree that they feel welcome in their school.
So, in the file, we look at the Student # of Responses page and columns D. and E.
Example 1-1

Example 1-2

Example 1-3

Example 1-4

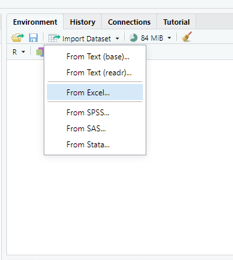
Importing the Excel file into RStudio so we can analyze the data
Example 1-5

Example 1-6

Example 1-7

Example 1-8

Example 1-9

Let us clear the console window so we have more space to write our code
Example 1-10

Example 1-11

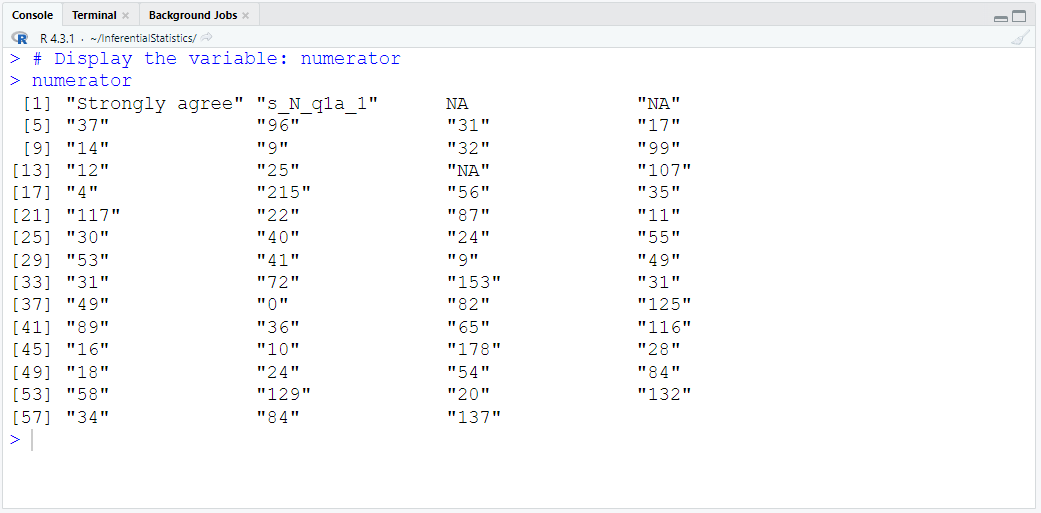
We are only interested in:
(a.) the number of students who responded (Column: Number of Student Responses).
There are NA and N_s also in that column. But we are interested in the numeric values.

(b.) the number of students who strongly agree that they feel welcome in their schools (Column: 1a. I feel welcome in my school.).
We shall deal with the numeric values only.

Objectives:
(1.) Construct a 95% confidence interval for the population proportion of New York City (NYC) Students in Grades 6 – 12 who strongly agree that they feel welcome in their schools in the year 2011.
(2.) Interpret the confidence interval.
(3.) Estimate the population proportion of New York City (NYC) Students in Grades 6 – 12 who strongly agree that they feel welcome in their schools in the year 2011.

Parameter to estimate: Population Proportion
Test: prop-test
Reason for Test: The population standard deviation was not given.
Verify Requirements for Test
(1.) The sample is a simple random sample.
(2.) The population is normally distributed.

$ \hat{p} = \dfrac{x}{n} \\[5ex] $ where:
p̂ = sample proportion or estimated proportion of successes
x = number of individuals in the sample with the specified characteristic
n = sample size

We have to write the codes now: the codes to:
(a.) determine the number of all the students who strongly agree that they feel welcome in their schools in the year 2011.
This is the numerator: $x$ (1a. I feel welcome in my school.)
It is the number of individuals in the sample with the specified characteristic.

(b.) determine the total number of all the students who responded.
This is the denominator: $n$ (Number of Student Responses)
It is the sample size .

Please NOTE: Some students may ask why I did not use the "Number of Eligible Students"
Let me explain and hopefully, this explanation will make some sense to you. If it does not, please let me know so I'll try another approach/example.
The "Number of Eligible Students" is the population size.
As you may have noticed, every eligible student did not respond to the survey.
So, we want to use the ones who responded to determine everyone's response
In other words, we want to use the sample proportion (the proportion of the ones who responded) to estimate the population proportion (the proportion of all the eligible students.)
This is known as Inferential Statistics: using the results from a sample to infer on the population.


Let us do some explanations before we write the codes:
(1.) It is always good to work with a copy so we do not mess up the original should we need to use it again.
(a.) So, we shall make a copy of the dataset.
(b.) Then, we shall use appropriate variaables to represent each of the two columns, beginning with the column for the numerator: (1a. I feel welcome in my school.)

(2.) There is one header row.
There are 59 rows.
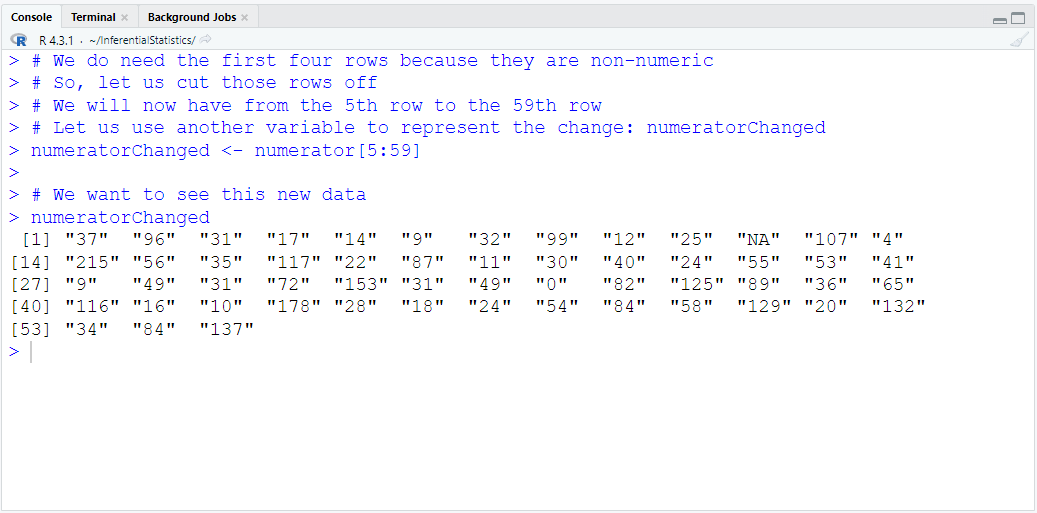
The first four rows of the two columns that we need, contain non-numeric values. We do not need those values.
So, we shall focus on the values from the 5th row up to the 59th row for the two columns.

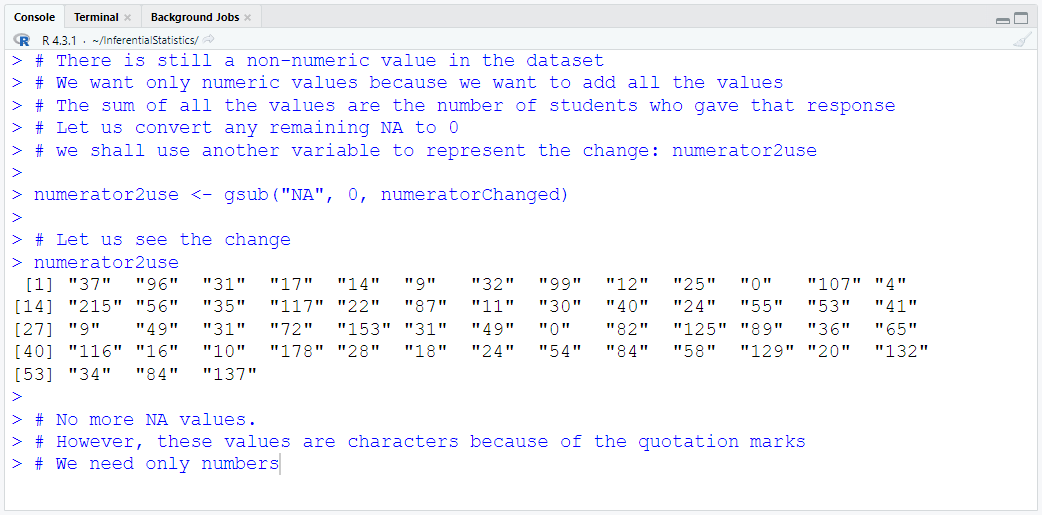
(3.) There is at least one "NA" (Not Available) non-numeric value in each of the two columns.
We shall replace those "NA" values with 0's using the gsub() function.
This is important so we can add them with the numeric values.

(4.) We shall determine the class of the data values and make sure they are numeric.
This is done using the class() function.
If they are not numeric, we shall convert them to mumeric values using the as.numeric() function.

(5.) Then, we shall add the data values in each of the two columns.

Example 1-12

Example 1-13

Example 1-14

Example 1-15

Example 1-16

We are done with the numerator.
Some students probably liked the use of several variables.
Some students probably did not. I can imagine some programmers that will be frustrated at me for using many variables.
Can we write all these using few variables and few lines of code? Of course, we can.
So, let us write the code for the denominator (finding the sample size) using only two variables and few lines of code.


Example 1-17
Did you notice the single code that did the work? 😊

Example 1-18

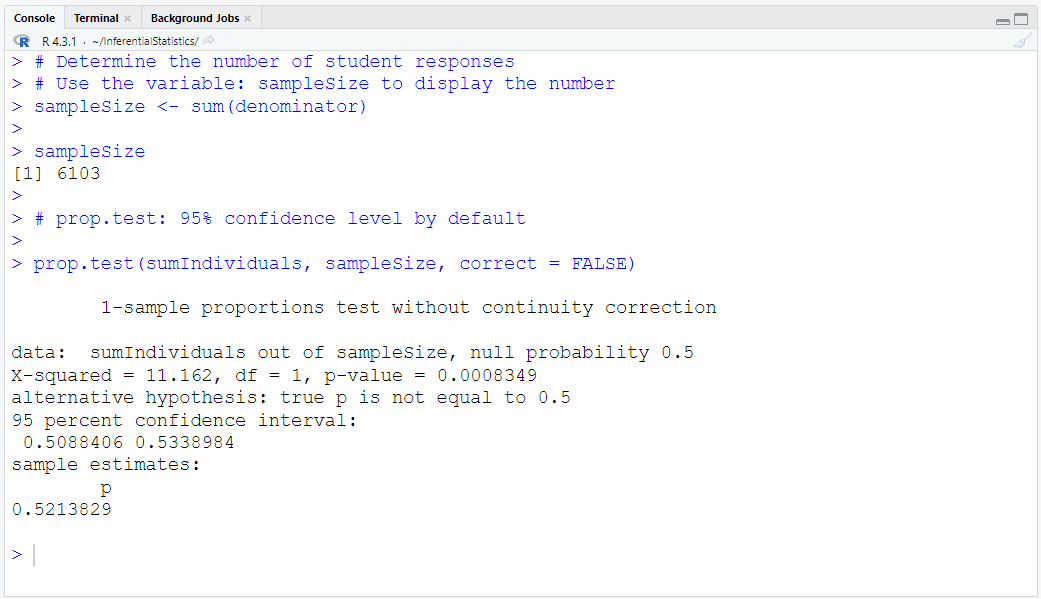
(6.) Run the prop.test() function.
The sample size is greater than 30. So, we shall use the argument: correct = FALSE
If the sample size was less than 30, we shall use the argument: correct = TRUE
Also, if the confidence interval is not specified in the argument, it is 95% by default

Example 1-19

Based on the results:
The sample proportion (point estimate) is 0.5213829
The 95% confidence interval is (0.5088406, 0.5338984)
This implies that New York City Department of Education District 75 is 95% confident that the population percentage of students who strongly agree they feel welcome in their schools in the year 2011 is between 50.88406% and 52.13829%


Top

Inferential Statistics: Population Mean: One Sample

Dataset: women
Source: R/RStudio
Description:
This data set gives the average heights and weights for American women aged 30 – 39.
The data set appears to have been taken from the American Society of Actuaries Build and Blood Pressure Study for some (unknown to us) earlier year.
The World Almanac notes: “The figures represent weights in ordinary indoor clothing and shoes, and heights with shoes”.
Example 1-1
Example 1-2
Example 1-3

Variable: Height
Unit of the variable: inches
Sample Size: 15
Sample: 15 American women aged 30 – 39 in the year 2000
Population: All American women aged 30 – 39 in the year 2000
Assume Year: 2000 (The year is unknown, hence we assume the year.)
Objectives:
(1.) Construct a 95% confidence interval for the population mean of the heights of American women aged 30 – 39 in the year 2000.
(2.) Interpret the confidence interval.
(3.) Estimate the population mean of the heights of American women aged 30 – 39 in the year 2000.
(In other words, we want to use the heights of 15 American women aged 30 – 39 in the year 2000 to estimate the average height of all American women aged 30 – 39 in the year 2000)

Parameter to estimate: Population Mean
Test: t-test
Reason for Test: The population standard deviation was not given.
Verify Requirements for Test
(1.) The sample is a simple random sample.
(2.) The population is normally distributed.
(3.) The sample size is less than 5% of the population size.
Example 1-4

95% Confidence Interval for Population Mean from Sample Data
We shall use the t.test() function
Because we are only interested in the heights, we shall use: t.test(women$height)
If the confidence interval is not specified in the argument, it is 95% by default

Example 1-5

Based on the results:
The test statistic is 56.292
The degrees of freedom is 14
The sample mean is 65 inches
The 95% confidence interval is (62.52341, 67.47659) inches
We are 95% confident the population mean of the heights of American women aged 30 – 39 in the year 2000 is between 62.52341 inches and 67.47659 inches.
This implies that in about 95% of all the samples of American women aged 30 – 39 in the year 2000, the confidence interval will contain the population mean of (62.52341, 67.47659) inches.


Top

Hypothesis Test: Population Mean: Two Samples: Matched Pairs

Dataset: MatchedWeights (the name we shall give it because it does not have a name)
Source: MyLab Math (MLM)
1st Column: Reported Weights
2nd Column: Measured Weights
Description:
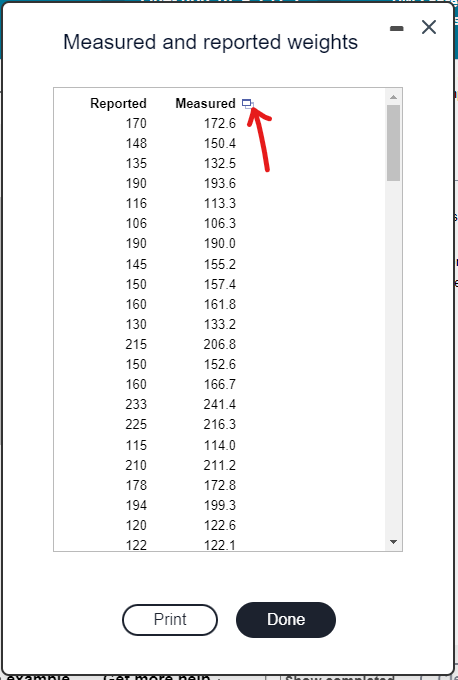
The data set gives the measured and reported weights (in pounds) of 127 female subjects.
Question:
Listed in the accompanying table are 127 measured and reported weights (lb) of female subjects.
Use the listed paired sample data, and assume that the samples are simple random samples and that the differences have a distribution that is approximately normal.

(a.) Use a 0.05 significance level to test the claim that for​ females, the measured weights tend to be higher than the reported weights.
In this​ example, μd is the mean value of the differences d for the population of all pairs of​ data, where each individual difference d is defined as the measured weight minus the reported weight.
What are the null and alternative hypotheses for the hypothesis​ test?

The difference is the: measured weights minus the reported weights.
Null Hypothesis: H0: μd = 0 (because the measured weights is assumed to be equal to the reported weights.)
Alternative Hypothesis: H1: μd > 0 (because the measured weights tend to be higher than the reported weights.)

(b.) Test the claim that the measured weights tend to be higher than the reported weights for females.
Use at least two approaches.
Interpret your results. This includes your decision and your conclusion.

Variable of both subjects: Weight
Unit of the variable(s): pounds
Sample Size for both subjects: 127
Sample: 127 American females in the year 2023 (the nationality and year are assumed.)
Population: All American females in the year 2023 (the nationality and year are assumed.)
Objectives:
(1.) Test the claim that the measured weights of 127 American females in year 2023 are higher than their reported weights using the Critical Value Method (Classical Approach).
(2.) Test the claim that the measured weights of 127 American females in year 2023 are higher than their reported weights using the P-Value (Probability-Value) Approach.
(3.) Test the claim that the measured weights of 127 American females in year 2023 are higher than their reported weights using the Confidence Interval Method.
(4.) Interpret the results.
(5.) Write the decision.
(6.) State the conclusion.

Parameter to test: Population Mean
Test: t-test
Direction of Test: Right-tailed test (because of the greater than symbol: > in the alternative hypothesis)
Reason for Test: The population standard deviation was not given.
Verify Requirements for Test
(1.) The sample data are matched pairs and equal sample size.
(2.) The matched pairs are simple random samples.
(3.) The sample size is large (at least a sample size of 30 for each pair).
(4.) The population from which the pairs of values were drawn is normally distributed.

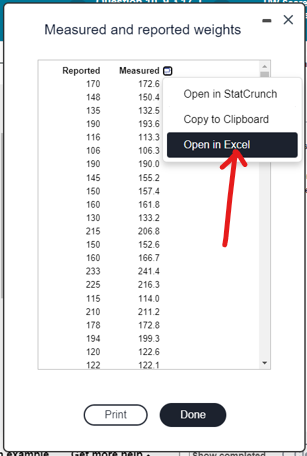
Download the dataset. Rename it to MatchedWeights
Matched Pairs: Example 1-1
Matched Pairs: Example 1-2
Matched Pairs: Example 1-3
Matched Pairs: Example 1-4
Matched Pairs: Example 1-5

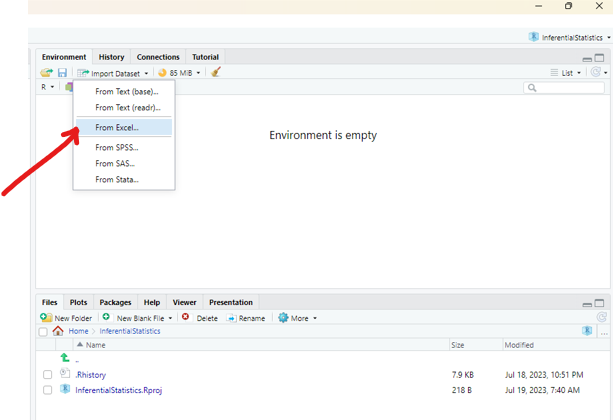
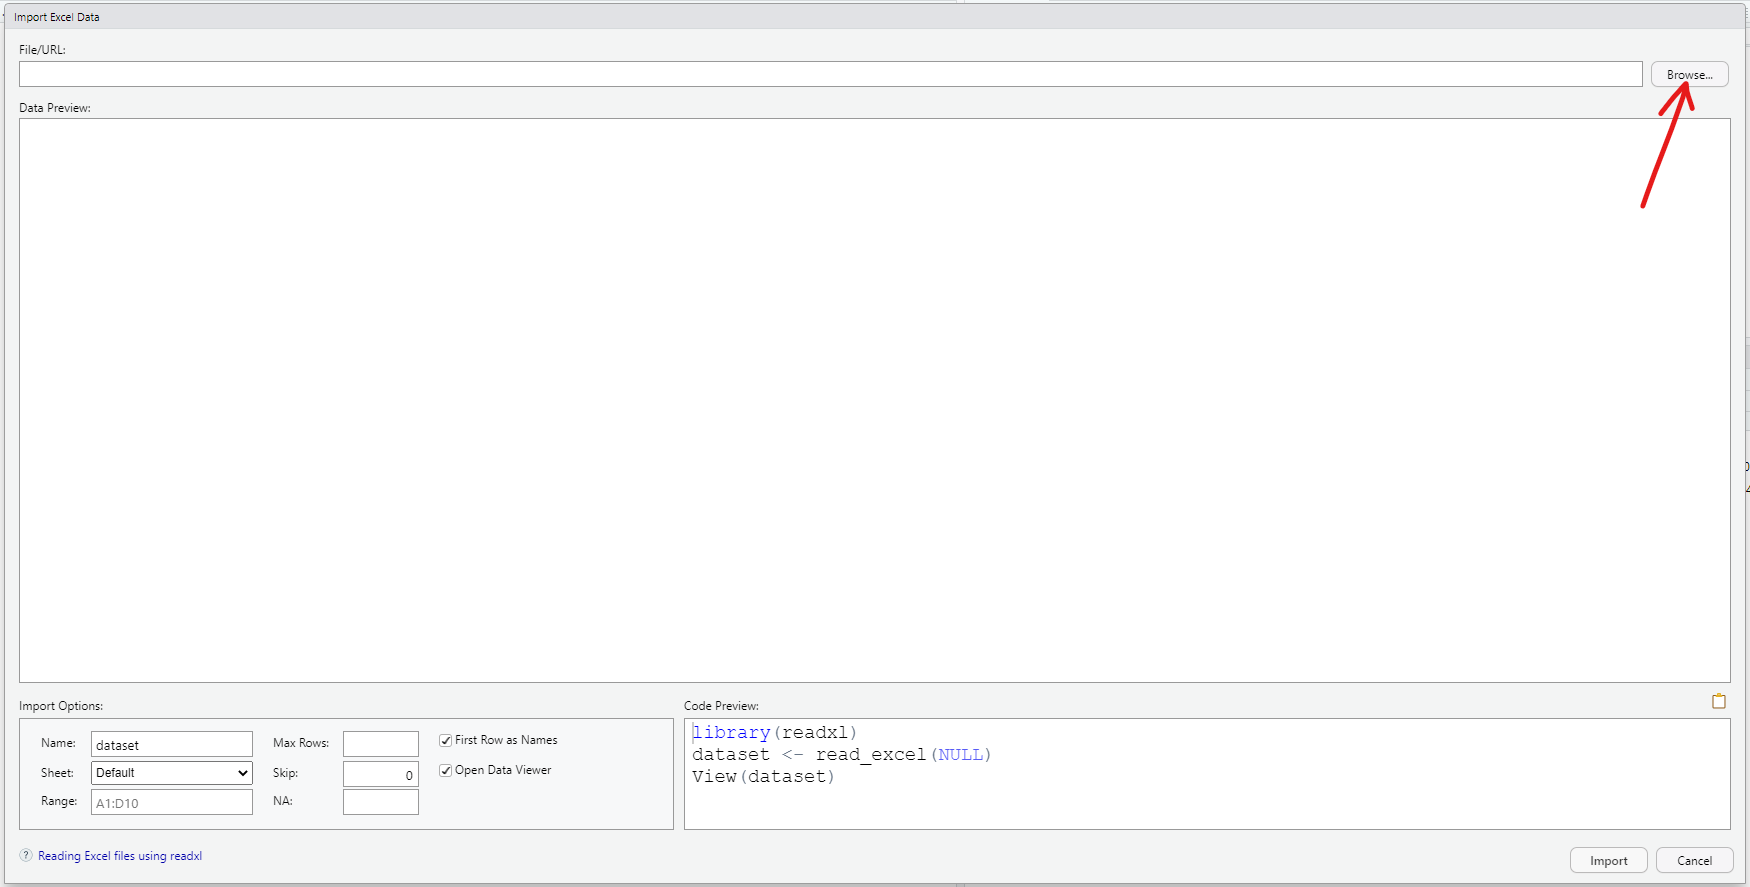
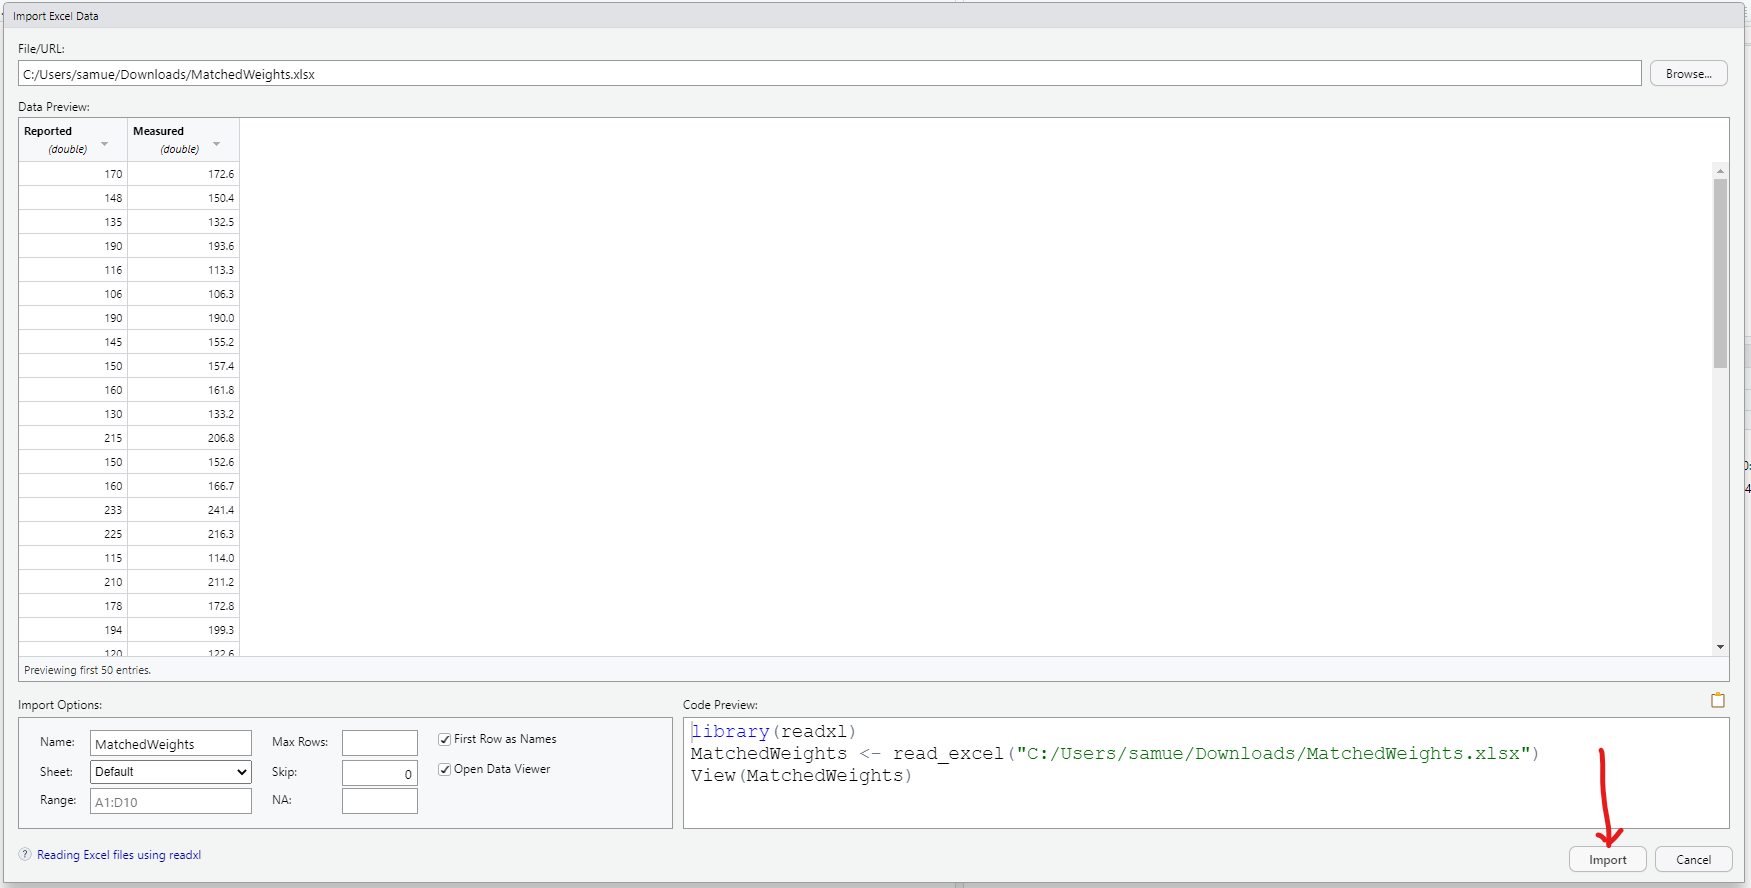
Import the dataset into RStudio
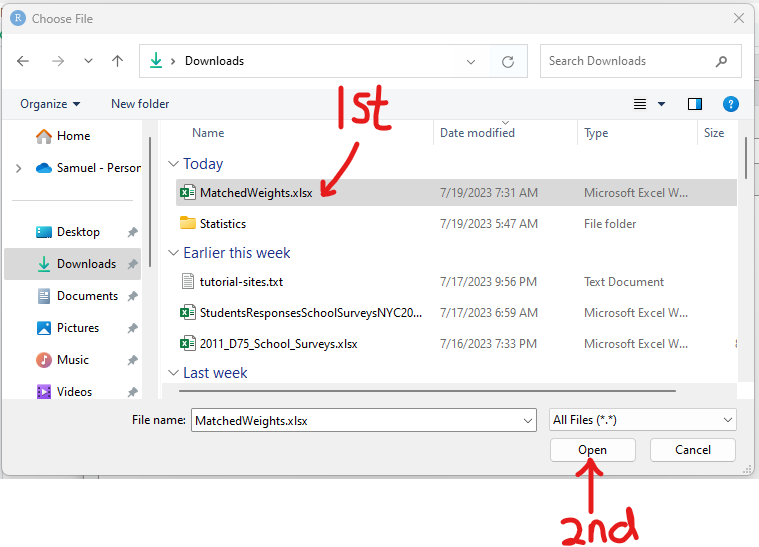
Matched Pairs: Example 1-6
Matched Pairs: Example 1-7
Matched Pairs: Example 1-8
Matched Pairs: Example 1-9

1st Approach: Critical Value (Classical) Approach
Define and Assign Variables. Use appropriate names for the variables.

$ t = \dfrac{\bar{x}_d - \mu_d}{\dfrac{s_d}{\sqrt{n}}} \\[7ex] $ where:
$d$ is the differences for the paired sample data (difference between the measured weight and the reported weight)
$t$ is the t test statistic
$\bar{x}_d$ is the mean of the differences for the paired sample data
$s_d$ is the standard deviation of the differences for the paired sample data
$\mu_d$ is the mean value of the differences for the population of all the pairs of data
$n$ is the sample size of either sample (because of matched pair of samples)
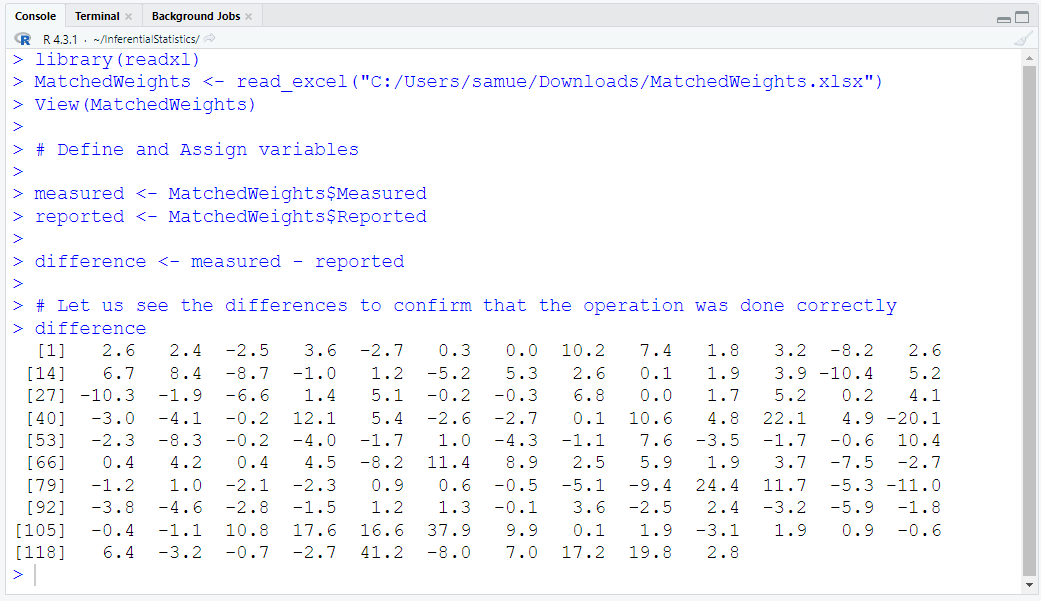
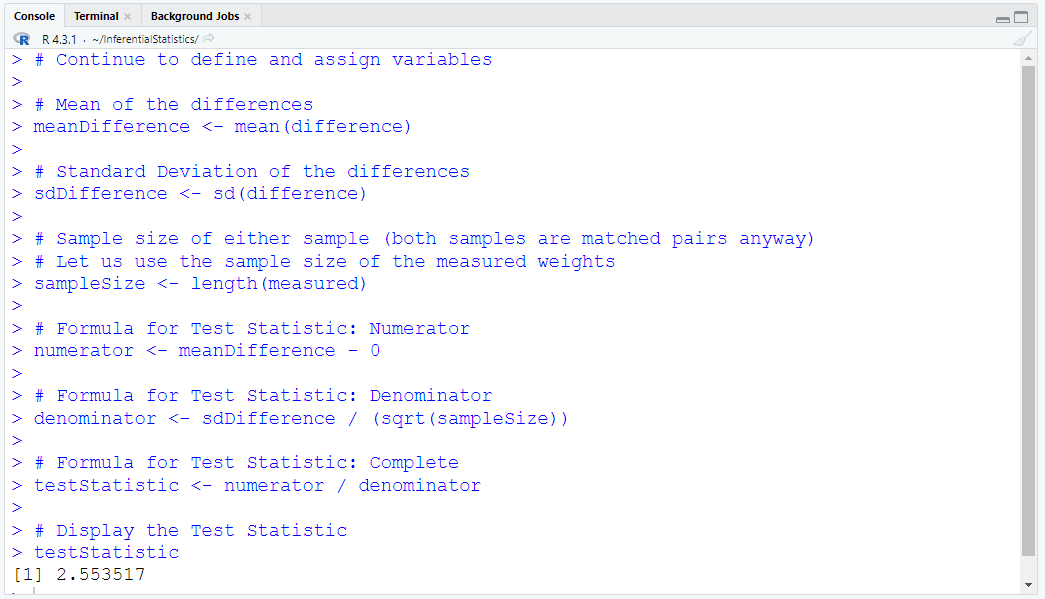
Matched Pairs: Example 1-10
Matched Pairs: Example 1-11
Matched Pairs: Example 1-12

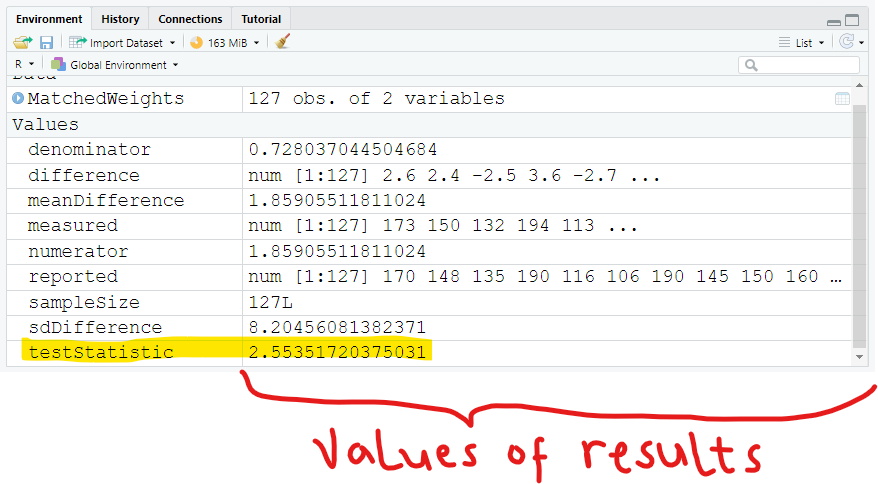
Did you notice the:
(a.) exact value of the test statistic?
(b.) approximate value of the test statistic?


We have determined the test statistic
We need to determine the critical value of the t distribution.
The level of significance is 0.05 (given by the question)
The test is a Right-tailed test (because of the alternative hypothesis)
The degrees of freedom for a one-tailed right-tailed test is 1 less than the sample size (sample size − 1)
The qt() function is used to determine the critical t
For one-tailed left-tailed test; the qt() function is: qt(p = significanceLevel, df = sampleSize − 1, lower.tail = TRUE) or
qt(p = significanceLevel, df = sampleSize) (because the lower tail is left-tailed by default, so omitting that argument treats the lower tail as left-tailed)
If we want a right-tailed test, then we set the lower tail to the Boolean value of FALSE
For one-tailed right-tailed test; the qt() function is: qt(p = significanceLevel, df = sampleSize − 1, lower.tail = FALSE)
For two-tailed test; the qt() function is: qt(p = significanceLevel / 2, df = sampleSize − 2, lower.tail = FALSE)

So, the code we shall use is: qt(p = 0.05, df = 126, lower.tail = FALSE)
Matched Pairs: Example 1-13
Matched Pairs: Example 1-14

Did you notice the:
(a.) exact value of the test statistic?
(b.) approximate value of the test statistic?


Interpretation:
Critical Value Method for Right-tailed test:
The t test statistic is: 2.55351720375031
The critical t value is: 1.65703698199071
The test statistic is greater than the critical value
This implies that the test statistic falls in the critical region
Decision: Reject the null hypothesis
Conclusion: There is sufficient evidence to support the claim that measured weights tend to be higher than the reported weights.

2nd Approach: Probability-Value (P-Value) Approach
Let us determine the probability that the critical value is greater than the test statistic
To determine this probability, we shall use the pt() function
For one-tailed left-tailed test; P(criticalT < −testStatistic) is the pt() function, and is: pt(p = −1 * testStatistic, df = sampleSize − 1, lower.tail = TRUE) or
pt(p = -1 * testStatistic, df = sampleSize) (because the lower tail is left-tailed by default, so omitting that argument treats the lower tail as left-tailed)
If we want a right-tailed test, then we set the lower tail to the Boolean value of FALSE
For one-tailed right-tailed test; P(criticalT > testStatistic) is the pt() function, and is: pt(p = testStatistic, df = sampleSize − 1, lower.tail = FALSE)
For two-tailed test; [P(criticalT < −testStatistic) + P(criticalT > testStatistic)] is the pt() function, and is: pt(p = *testStatistic*, df = sampleSize − 2, lower.tail = FALSE)

So, the code we shall use is: pt(q = testStatistic, df = 126, lower.tail = FALSE)
Matched Pairs: Example 1-15
Matched Pairs: Example 1-16

Did you notice the:
(a.) exact value of the probability value?
(b.) approximate value of the probability value?


Interpretation:
Probability Value Method for Right-tailed test:
The significance level is: 0.05
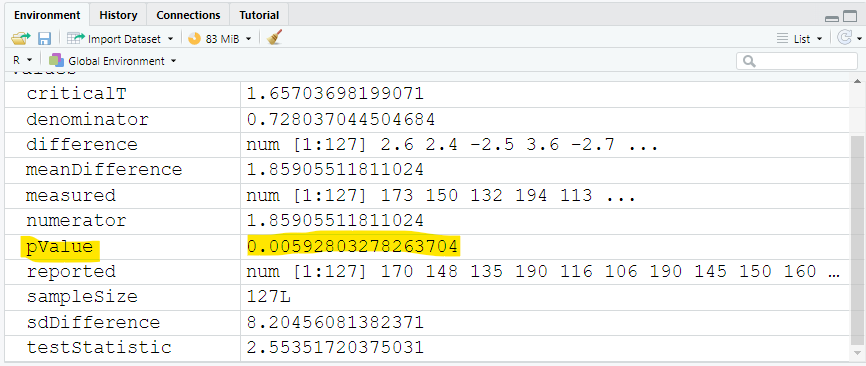
The probability value is: 0.00592803278263704
The probability value is less than the significance level
Decision: Reject the null hypothesis
Conclusion: There is sufficient evidence to support the claim that measured weights tend to be higher than the reported weights.

3rd Approach: Confidence Interval Approach
Define and Assign Variables. Use appropriate names for the variables.

$ CL = 1 - \alpha ...one-tailed\;\;test \\[3ex] CL = 1 - 0.05 \\[3ex] CL = 0.95 = 95\% \\[3ex] E = t_{\dfrac{\alpha}{2}} = \dfrac{s_d}{\sqrt{n}} \\[5ex] \underline{Confidence\;\;Interval} \\[3ex] \bar{x}_d - E \lt \mu_d \lt \bar{x}_d + E \\[3ex] $ where:
$\alpha$ is the significance level
$CL$ is the confidence level
$E$ is the margin of error
$t_{\dfrac{\alpha}{2}}$ is the critical t value
$\bar{x}_d - E$ is the lower bound of the confidence interval
$\bar{x}_d + E$ is the upper bound of the confidence interval
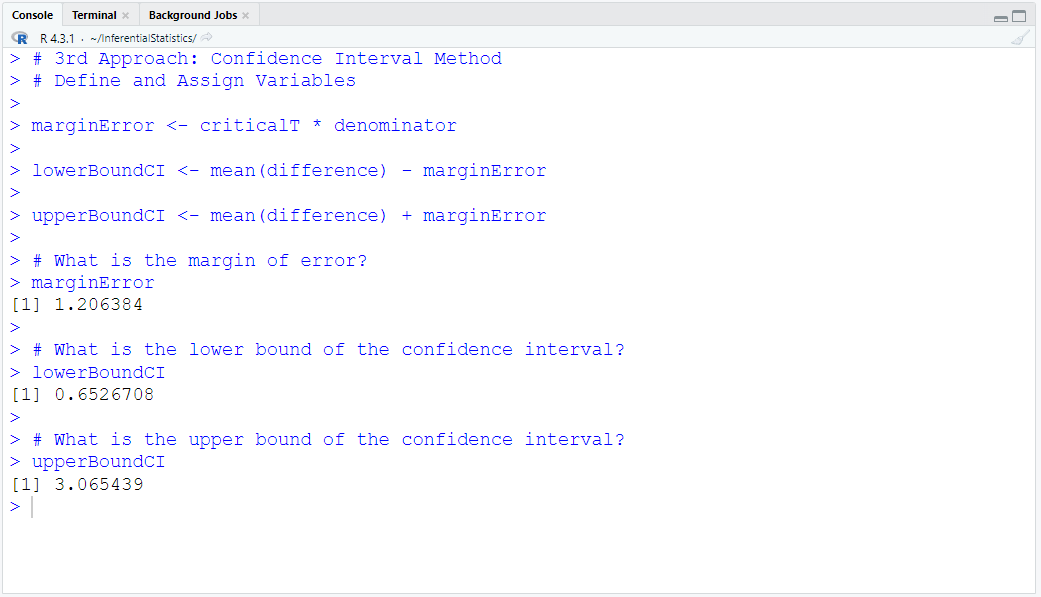
Matched Pairs: Example 1-17
Matched Pairs: Example 1-18

The 95% confidence interval is: (0.652670811106761, 3.06543942511371)

The lower bound of the confidence interval is: 0.652670811106761 pounds
The lower bound is greater than 0

The upper bound of the confidence interval is: 3.06543942511371 pounds
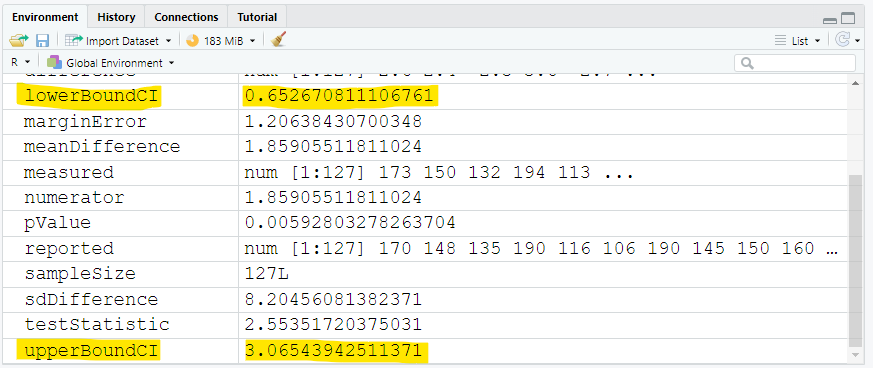
The upper bound is also greater than 0
The confidence interval does not contain 0.
Both bounds are positive. Therefore, it is likely that the mean of the differences is always greater than 0.
Decision: Reject the null hypothesis
Conclusion: There is sufficient evidence to support the claim that measured weights tend to be higher than the reported weights.


Top

References

Chukwuemeka, Samuel Dominic (2023). R and RStudio Statistics Software. Retrieved from https://statistical-science.appspot.com/

McNeil, D. R. (1977) Interactive Data Analysis. Wiley.
2011 D75 School Surveys. (2019, May 9). Data.gov; data.cityofnewyork.us. https://catalog.data.gov/dataset/2011-d75-school-surveys

Triola, M. F. (2022). Elementary Statistics. (14th ed.) Hoboken: Pearson.

R Guides (n.d.). Statology. https://www.statology.org/r-guides/


Top